Interactive Hexagon Grid Tutorial Part 1 - Intro
Greetings, friends! If you've visited the front page of my website, you may have seen a cool interactive hexagon grid made by yours truly. Hexagons are the bestagons afterall 😃
Follow along to see how I made the magic happen!
Introduction
Welcome to my amazing tutorial series on how to make an interactive hexagon grid that glows whenever you move the mouse over the hexagons. Have you tried hovering over all the hexagons on the front page of my website to see if anything happens? 🧐
This tutorial series will be quite special. There's nothing like it on the Internet! What makes it so special? Well, I'll be showing everyone two techniques for implementing the same hexagon grid. The first way will utilize the HTML canvas API via JavaScript. The second way will utilize shaders built using GLSL. We'll use Shadertoy to design fragment shaders and then port them to WebGL via Three.js to make our "interactive hexagon grid" hardware accelerated 😲
This is Part 1 of the interactive hexagon grid tutorial series and will focus on creating hexagons using the HTML canvas API. Let's get started!
HTML Canvas API Review
Let's quickly review fundamentals of the HTML Canvas API. For a full tutorial, please visit my HTML Canvas API tutorial series. Part 3 is the most relevant for creating polygons such as hexagons.
Let's create an HTML file with the following contents:
<!DOCTYPE html>
<html lang="en">
<head>
  <meta charset="UTF-8">
  <meta name="viewport" content="width=device-width, initial-scale=1.0">
  <title>Interactive Hexagon Grid</title>
</head>
<body>
  <h1>Canvas API Tutorial</h1>
  <canvas id="canvas" width="500" height="500" style="border: 1px solid black;"></canvas>
  <script src="canvas.js"></script>
</body>
</html>
Then, we'll create a JavaScript file called canvas.js that will identify the canvas element and create a 2D context.
const canvas = document.getElementById('canvas');
const ctx = canvas.getContext('2d');
If you're using a code editor that supports JSDoc such as VS Code, we can add a JSDoc comment before the first line.
/** @type {HTMLCanvasElement} */
const canvas = document.getElementById('canvas');
const ctx = canvas.getContext('2d');
Now, IntelliSense should be available within our code editor, so we can see hints on what methods are available on the canvas and ctx objects.
Let's review how the coordinate system works in a 2D HTML canvas.
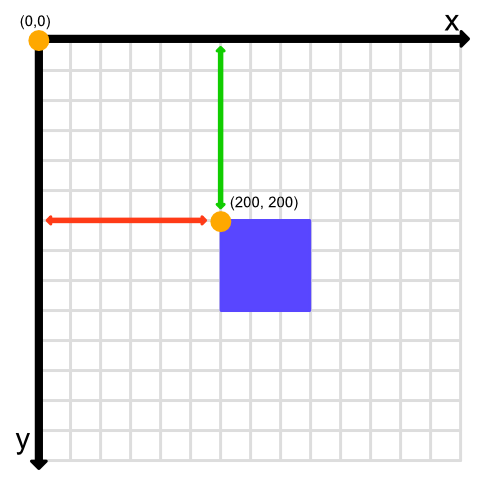
The origin point, (0, 0), is located on the top-left corner of the canvas. The x-axis increases as you go right, and the y-axis increases as you go down. The y-axis is opposite to what you might see in math textbooks. We'll see later than in WebGL, the y-axis goes back to normal and increases as you go up instead of down.
If we wanted to draw a square like in the above picture, then we could use the following code:
/** @type {HTMLCanvasElement} */
const canvas = document.getElementById('canvas');
const ctx = canvas.getContext('2d');

ctx.fillStyle = '#3056ff';
ctx.fillRect(200, 200, 50, 50); // The parameters are x, y, width, height, respectively

Alternatively, we could have used line segments to draw the square. We first begin a new path, use either ctx.moveTo or ctx.lineTo to initialize a starting point, and then close the path. Once the path is closed, the shape we drew can have a stroke and/or fill applied. Let's look at an example.
/** @type {HTMLCanvasElement} */
const canvas = document.getElementById('canvas');
const ctx = canvas.getContext('2d');

ctx.beginPath();
ctx.lineTo(200, 200); // ctx.moveTo(200, 200) also could have been used here
ctx.lineTo(250, 200);
ctx.lineTo(250, 250);
ctx.lineTo(200, 250);
ctx.closePath();

ctx.fillStyle = '#3056ff';
ctx.fill();
We will be using lines to draw our hexagons for this tutorial, but first, we need to learn hexagon geometry.
Hexagon Geometry
In this tutorial, we'll be creating a grid of regular hexagons. That is, we'll create hexagons where each side of the hexagon is the same length and each angle between line segments is the same. Regular hexagons have an angle of 60° (60 degrees) between each line segment. 60° is equivalent to 2π/6 radians or π/3 radians.
Hexagons have a special property where they are cyclic, meaning that we can circumscribe a circle around the hexagon and each vertex of the hexagon touches a point on the circle. By circumscribing the hexagon with a unit circle, we can clearly see how each hexagon vertex relates to the center origin point.
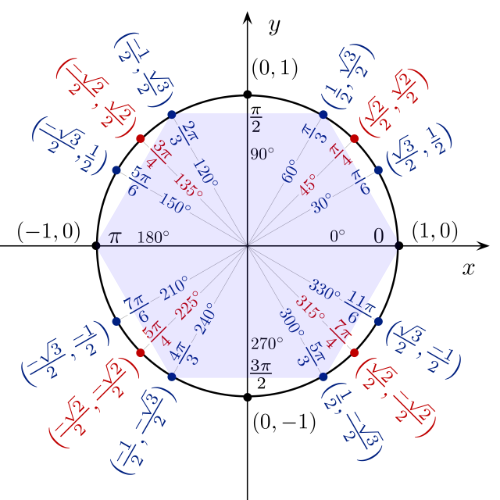
In the image above, the origin has a coordinate of (0, 0) on a standard graph. Keep in mind that this image shows points plotted on a typical x-y plane, with the y-axis increasing as you go up.
There are six points of interest that we care about in the image. Those are the vertices of the hexagon, located at the following angles (in counter-clockwise order):
- 0° = 360° = 0 radians = 2π radians
- 60° = 2π/6 radians = π/3 radians
- 120° = 4π/6 radians = 2π/3 radians
- 180° = 6π/6 radians = 3π/3 radians = π radians
- 240° = 8π/6 radians = 4π/3 radians
- 300° = 10π/6 radians = 5π/3 radians
These angles correspond to the following points on the unit circle (in counter-clockwise order):
- (1, 0)
- (1/2, √3/2)
- (-1/2, √3/2)
- (-1, 0)
- (-1/2, -√3/2)
- (1/2, -√3/2)
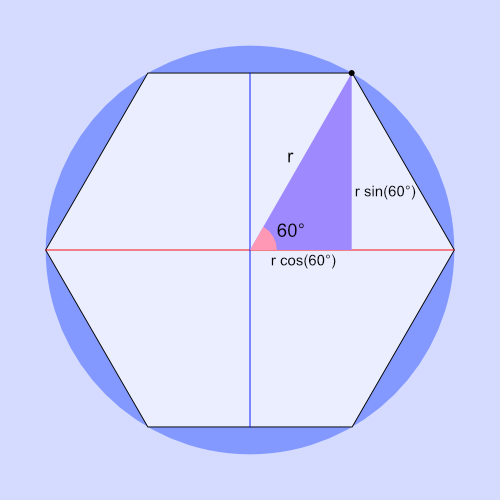
How were the values inside each coordinate obtained? Through trigonometry of course!
Suppose we drew a right triangle inside the hexagon such that the hypotenuse extends from the origin to the top-right point of the hexagon. We can determine that the x-coordinate is equal to r * cos(θ) where r is the radius and θ (theta) equals the angle between the x-axis and a hexagon vertex (point on the unit circle). The y-coordinate is equal to r * sin(θ). In a unit circle, the radius equals one.
We can therefore represent the x-coordinate and y-coordinate of any point on the unit circle relative to the center origin point at (0, 0) using mathematical expressions.
// theta = angle with respect to the x-axis
// r = radius of the circle/hexagon
x = r * cos(theta)
y = r * sin(theta)
If we want to move/translate our origin away from (0, 0), then we need to add values, a and b, for the x-axis and y-axis, respectively.
x = a + r * cos(theta)
y = b + r * sin(theta)
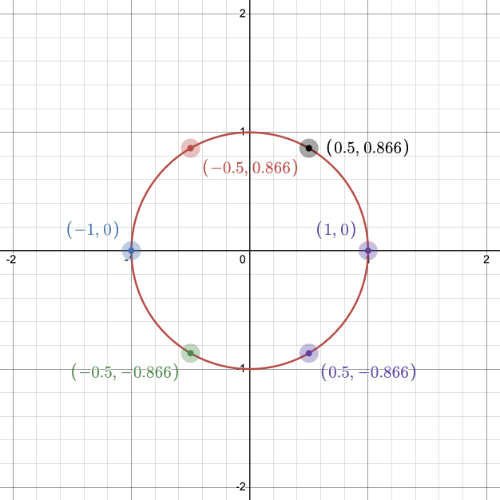
By shifting the origin, we can shift the whole hexagon and unit circle anywhere we want. I have created a Desmos graph illustrating how this works. Try playing around with the values of r, a, and b. Notice how all points on the hexagon move relative to the origin point defined by the coordinate, (a, b).
Drawing Hexagons
Now that we can find all points of a hexagon relative to a single point, let's start drawing hexagons using the HTML canvas API. We will use the ctx.lineTo method six times for each vertex of a hexagon. After beginning a new path, the first call to ctx.lineTo initializes a starting point, similar to ctx.moveTo. Then, the next calls to ctx.lineTo will draw lines from one point to another. After we create the full path, we close it and call ctx.stroke and/or ctx.fill to visualize the shape we just drew.
Let's see how this is implemented in JavaScript code:
/** @type {HTMLCanvasElement} */
const canvas = document.getElementById('canvas');
const ctx = canvas.getContext('2d');

const r = 50; // radius
const a = 200; // x-coordinate of origin point
const b = 200; // y-coordinate of origin point

ctx.beginPath();
ctx.lineTo(a + r * Math.cos(0 * Math.PI / 3), b + r * Math.sin(0 * Math.PI / 3));
ctx.lineTo(a + r * Math.cos(1 * Math.PI / 3), b + r * Math.sin(1 * Math.PI / 3));
ctx.lineTo(a + r * Math.cos(2 * Math.PI / 3), b + r * Math.sin(2 * Math.PI / 3));
ctx.lineTo(a + r * Math.cos(3 * Math.PI / 3), b + r * Math.sin(3 * Math.PI / 3));
ctx.lineTo(a + r * Math.cos(4 * Math.PI / 3), b + r * Math.sin(4 * Math.PI / 3));
ctx.lineTo(a + r * Math.cos(5 * Math.PI / 3), b + r * Math.sin(5 * Math.PI / 3));
ctx.closePath();
ctx.stroke();
When we run the code, we should see a hexagon appear! Yay! ⬣
You may have noticed a pattern in the code above. We are simply adding π/3 to our angle every time we move to the next point in our hexagon. Let's make a function that can draw a hexagon at any point we want.
/** @type {HTMLCanvasElement} */
const canvas = document.getElementById('canvas');
const ctx = canvas.getContext('2d');

const r = 50; // radius

function drawHexagon(a, b) {
  ctx.beginPath();
  for (let i = 0; i < 6; i++) {
    ctx.lineTo(
      a + r * Math.cos((i * Math.PI) / 3),
      b + r * Math.sin((i * Math.PI) / 3)
    );
  }
  ctx.closePath();
  ctx.stroke();
}

drawHexagon(200, 200);
When this code is run, we should see the hexagon drawn to the same spot, but now we have control of where we draw the hexagon.
Let's now add a small circle where our origin point is located, so we can clearly see where the center of the hexagon is located. As mentioned in Part 2 of my HTML canvas API series, we can make a circle using the following code:
ctx.beginPath();
ctx.arc(a, b, r, 0, 2 * Math.PI);
ctx.fill();
Where (a, b) is the coordinate for the circle's origin and r is the circle's radius. If you need help understanding the ctx.arc method, please try out my Canvas Playground app and select "Circle" from the dropdown menu.
Adding this to our code, we get the following:
/** @type {HTMLCanvasElement} */
const canvas = document.getElementById('canvas');
const ctx = canvas.getContext('2d');

const r = 50; // radius

function drawHexagon(a, b) {
  ctx.beginPath();
  for (let i = 0; i < 6; i++) {
    ctx.lineTo(
      a + r * Math.cos((i * Math.PI) / 3),
      b + r * Math.sin((i * Math.PI) / 3)
    );
  }
  ctx.closePath();
  ctx.stroke();

  ctx.beginPath();
  ctx.arc(a, b, r * 0.1, 0, 2 * Math.PI);
  ctx.fill();
}

drawHexagon(200, 200);
In the code above, I opted to make the circle have 10% of the hexagon's radius. That way, we can still see the point regardless of the hexagon size.
Drawing a Hexagon Grid
Using our new drawHexagon function, we can now start creating a grid of hexagons, but first, we need to learn a bit more theory about how hexagons fit together. We want to arrange hexagons in such a way that there's no gaps in between them. The image below demonstrates how the grid should be laid out. Notice that the canvas origin is located at the top-left corner of the hexagon grid at the coordinate, (0, 0).
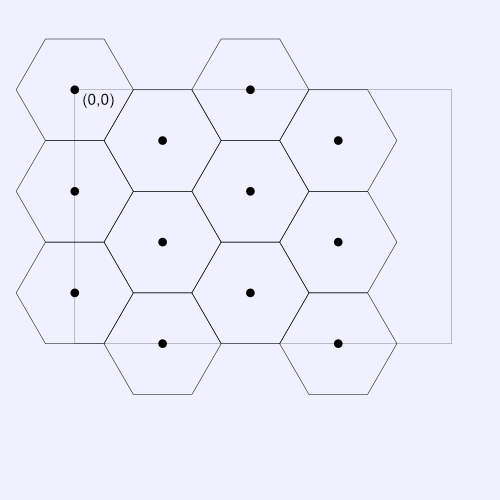
In order to draw this grid, we need to figure out where to place the center point of each hexagon. They will all have a coordinate that is relative to the origin, (0, 0). Let's zoom in on the top-left corner of the graph to calculate the distance between each hexagon's center point.
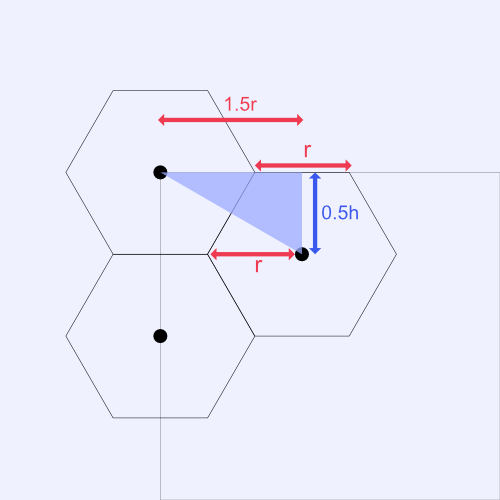
In a regular hexagon, the radius, r, of a hexagon is equal to the length of its side. Therefore, we can determine that the distance between the top and middle hexagon along the x-direction is equal to 1.5 * r. The distance along the y-direction is equal to 0.5 * h where h is the height of the hexagon. Recall from the unit circle mentioned earlier in this tutorial that half the height of a hexagon is simply r * sin(60°), which is equal to r * √3/2 or 0.5 * r * √3.
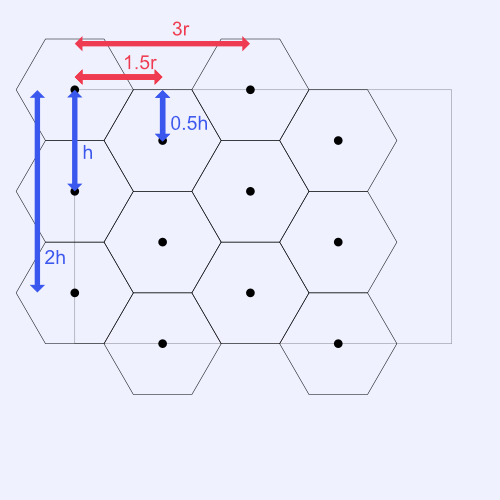
The image below shows the coordinates of a possible hexagon grid layout. Observe this image carefully. Each column has a very noticeable pattern: the x-coordinate is the same for each hexagon of the same column. However, each "row" of the hexagon grid forms a zigzag pattern and doesn't line up in a straight line. The hexagons alternate their y-coordinate by an offset of 0.5 * h.
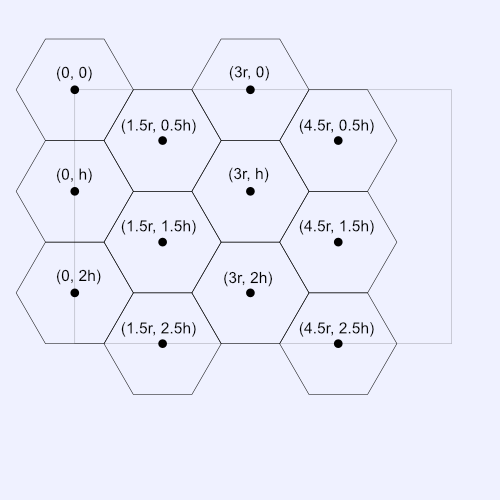
You may be thinking, "How am I going to code this? Is it still possible to create a nested for-loop that draws a grid of hexagons?" The answer is "Yes, it is!" But, it requires identifying some interesting patterns. Let's start drawing the first "zigzag" row of hexagons to see if we can notice a pattern.
/** @type {HTMLCanvasElement} */
const canvas = document.getElementById('canvas');
const ctx = canvas.getContext('2d');

const r = 50; // radius

function drawHexagon(a, b) {
  ctx.beginPath();
  for (let i = 0; i < 6; i++) {
    ctx.lineTo(
      a + r * Math.cos((i * Math.PI) / 3),
      b + r * Math.sin((i * Math.PI) / 3)
    );
  }
  ctx.closePath();
  ctx.stroke();

  ctx.beginPath();
  ctx.arc(a, b, r * 0.1, 0, 2 * Math.PI);
  ctx.fill();
}

drawHexagon(0, 0);
drawHexagon(1.5 * r, 0.5 * r * Math.sqrt(3));
drawHexagon(3 * r, 0);
drawHexagon(4.5 * r, 0.5 * r * Math.sqrt(3));
drawHexagon(6 * r, 0);
drawHexagon(7.5 * r, 0.5 * r * Math.sqrt(3));
drawHexagon(9 * r, 0);
drawHexagon(10.5 * r, 0.5 * r * Math.sqrt(3));
Running this code should create a result similar to the following image:
If we look back at our code, we can see that the x-coordinate increases by 1.5 * r as we move to the right. The y-coordinate alternates between zero and 0.5 * r * Math.sqrt(3) as we move to the right as well. We can easily write this code as a for-loop by checking whether our iteration variable, i, is odd or even.
for (let i = 0; i < 8; i++) {
  const x = 1.5 * r * i;
  const y = i % 2 === 0 ? 0 : 0.5 * r * Math.sqrt(3);
  drawHexagon(x, y);
}
If we replace all the drawHexagon calls with this for-loop, then we should see the same result. Next, we need to draw the second row. Let's try drawing both the first and second zigzag rows without using any for-loops to see if we can notice another pattern.
/** @type {HTMLCanvasElement} */
const canvas = document.getElementById('canvas');
const ctx = canvas.getContext('2d');

const r = 50; // radius

function drawHexagon(a, b) {
  ctx.beginPath();
  for (let i = 0; i < 6; i++) {
    ctx.lineTo(
      a + r * Math.cos((i * Math.PI) / 3),
      b + r * Math.sin((i * Math.PI) / 3)
    );
  }
  ctx.closePath();
  ctx.stroke();

  ctx.beginPath();
  ctx.arc(a, b, r * 0.1, 0, 2 * Math.PI);
  ctx.fill();
}

// First zigzag row
drawHexagon(0, 0);
drawHexagon(1.5 * r, 0.5 * r * Math.sqrt(3));
drawHexagon(3 * r, 0);
drawHexagon(4.5 * r, 0.5 * r * Math.sqrt(3));
drawHexagon(6 * r, 0);
drawHexagon(7.5 * r, 0.5 * r * Math.sqrt(3));
drawHexagon(9 * r, 0);
drawHexagon(10.5 * r, 0.5 * r * Math.sqrt(3));

// Second zigzag row
drawHexagon(0, r * Math.sqrt(3));
drawHexagon(1.5 * r, 1.5 * r * Math.sqrt(3));
drawHexagon(3 * r, r * Math.sqrt(3));
drawHexagon(4.5 * r, 1.5 * r * Math.sqrt(3));
drawHexagon(6 * r, r * Math.sqrt(3));
drawHexagon(7.5 * r, 1.5 * r * Math.sqrt(3));
drawHexagon(9 * r, r * Math.sqrt(3));
drawHexagon(10.5 * r, 1.5 * r * Math.sqrt(3));
Notice the pattern yet? The second zigzag row is the same as the first row except that the y-coordinate now fluctuates between r * Math.sqrt(3) and 1.5 * r * Math.sqrt(3). Each hexagon in a zigzag row still fluctuates by a value of 0.5 * r * Math.sqrt(3). Refer to the unit circle image shown earlier in this tutorial if you need to refresh on how the vertical spacing between hexagon centers was determined.
Given this knowledge, we should have enough info for creating an entire hexagon grid using a nested for-loop. Let's see how we can implement this in code:
for (let i = 0; i < 8; i++) {
  for (let j = 0; j < 8; j++) {
    const x = i * 1.5 * r;
    const y = i % 2 === 0 ?
      j * r * Math.sqrt(3) :
      j * r * Math.sqrt(3) + 0.5 * r * Math.sqrt(3);
    drawHexagon(x, y);
  }
}
Using some math, we can simplify this for-loop even further:
j * r * Math.sqrt(3) + 0.5 * r * Math.sqrt(3)
  = (j + 0.5) * r * Math.sqrt(3)
Our for-loop then becomes the following:
for (let i = 0; i < 8; i++) {
  for (let j = 0; j < 8; j++) {
    const x = i * 1.5 * r;
    const y = i % 2 === 0 ?
      j * r * Math.sqrt(3) :
      (j + 0.5) * r * Math.sqrt(3);
    drawHexagon(x, y);
  }
}
We can then turn this nested for-loop into a function called drawHexagonGrid. Our finished code should look like the following:
/** @type {HTMLCanvasElement} */
const canvas = document.getElementById('canvas');
const ctx = canvas.getContext('2d');

const r = 50; // radius

function drawHexagon(a, b) {
  ctx.beginPath();
  for (let i = 0; i < 6; i++) {
    ctx.lineTo(
      a + r * Math.cos((i * Math.PI) / 3),
      b + r * Math.sin((i * Math.PI) / 3)
    );
  }
  ctx.closePath();
  ctx.stroke();

  ctx.beginPath();
  ctx.arc(a, b, r * 0.1, 0, 2 * Math.PI);
  ctx.fill();
}

function drawHexagonGrid(sizeX, sizeY) {
  for (let i = 0; i < sizeX; i++) {
    for (let j = 0; j < sizeY; j++) {
      const x = i * 1.5 * r;
      const y = i % 2 === 0 ?
        j * r * Math.sqrt(3) :
        (j + 0.5) * r * Math.sqrt(3);
      drawHexagon(x, y);
    }
  }
}

drawHexagonGrid(8, 8);
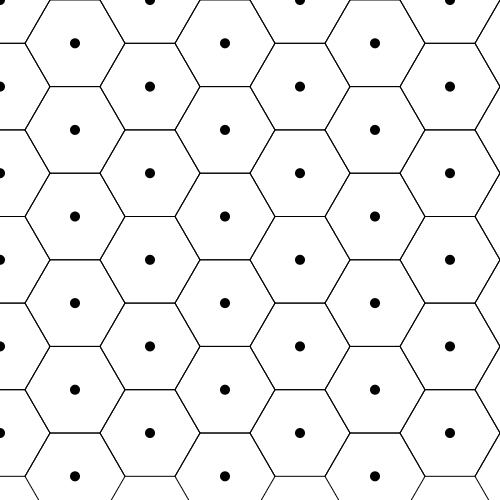
After running this code, we should see a complete hexagon grid inside the canvas! Yay! 🎉
If you're satisfied with this method, then feel free to use it, but there is actually another way we can create our nested for-loop, one which gives us a bit more control over how the hexagons are drawn.
Drawing Straight Rows in Hexagonal Grids
In the previous section, we learned how to draw a hexagonal grid by drawing hexagons in a zigzag pattern, but this was just one way of filling up the HTML canvas with a bunch of hexagons. Depending on our use case, we may want to draw hexagons in a straight row instead. In fact, I use this strategy for my interactive hexagon canvas on the home page of this website.
When users hover over all the hexagons in the canvas, I play a special animation. The tricky part is making sure all the hexagons stay within view and don't reach outside the canvas. When we make a zigzag row of hexagons, the last row likely will extend outside the canvas. Therefore, we need to make some changes to our nested for-loop.
In our current implementation of drawing a hexagon grid, we are only concerned with the hexagon centers and how they relate to the i and j iteration variables. However, we can add more points to our hexagon grid to make the points form a rectangular grid-like pattern, so the points have the same width between each other. See the image below to visualize how we can make every point relative to the i and j values of our nested for-loop.
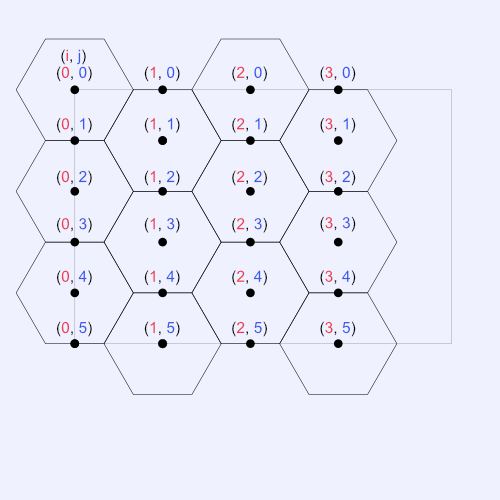
Notice a pattern? A hexagon center is located at every index where i and j are both even or both odd. Therefore, we can redesign our drawHexagonGrid function to have the following nested for-loop:
function drawHexagonGrid(sizeX, sizeY) {
  for (let i = 0; i < sizeX; i++) {
    for (let j = 0; j < sizeY; j++) {
      if (i % 2 === j % 2) {
        const x = i * 1.5 * r;
        const y = j * 0.5 * r * Math.sqrt(3);
        drawHexagon(x, y);
      }
    }
  }
}

drawHexagonGrid(8, 13);
Now, we have the advantage of being able to draw straight rows of hexagons and can prevent too many hexagons being drawn to the canvas. The code looks a bit cleaner too. Notice that the sizeY parameter we pass to the drawHexagonGrid function is now 13 instead of 8. That is because we have added more points to our grid and no longer draw complete zigzag rows. Try playing around with the sizeX and sizeY parameters to see how the hexagons are drawn.
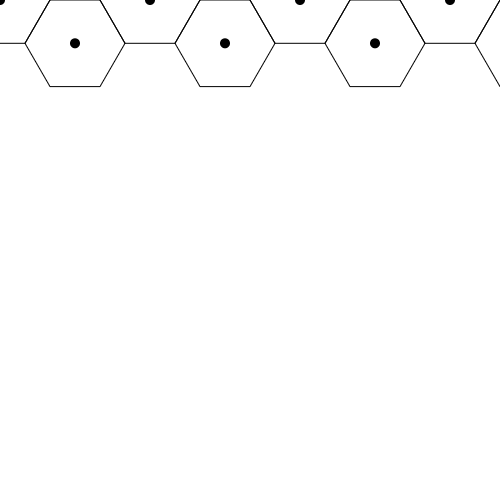
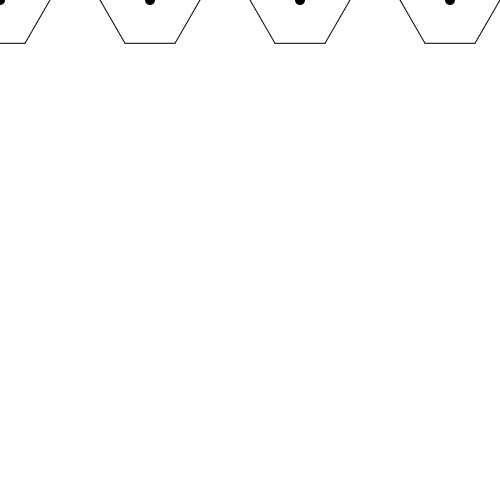
If we wanted to draw only the first row of hexagons in a straight line, we could pass a value of 1 to the sizeY variable in our drawHexagon function.
drawHexagonGrid(8, 1);
Then, we should see the following image.
Let's change our sizeY parameter back to 13 to make a full hexagon grid again. Our completed code should look like the following:
/** @type {HTMLCanvasElement} */
const canvas = document.getElementById('canvas');
const ctx = canvas.getContext('2d');

const r = 50; // radius

function drawHexagon(a, b) {
  ctx.beginPath();
  for (let i = 0; i < 6; i++) {
    ctx.lineTo(
      a + r * Math.cos(i * Math.PI / 3),
      b + r * Math.sin(i * Math.PI / 3)
    );
  }
  ctx.closePath();
  ctx.stroke();

  ctx.beginPath();
  ctx.arc(a, b, r * 0.1, 0, 2 * Math.PI);
  ctx.fill();
}

function drawHexagonGrid(sizeX, sizeY) {
  for (let i = 0; i < sizeX; i++) {
    for (let j = 0; j < sizeY; j++) {
      if (i % 2 === j % 2) {
        const x = i * 1.5 * r;
        const y = j * 0.5 * r * Math.sqrt(3);
        drawHexagon(x, y);
      }
    }
  }
}

drawHexagonGrid(8, 13);
Conclusion
In this tutorial, we learned how to draw hexagons using the HTML canvas API and learned two different ways of drawing hexagon grids. In the next tutorial, we'll learn how to add interactions to our hexagon grid, so the hexagons light up when a user hovers their mouse over them ✨. See you there!