HTML5 Canvas API Tutorial Part 6 - Pixel Manipulation
Greetings, friends! Welcome to Part 6 of my HTML5 Canvas API series. In this tutorial, I will discuss how to manipulate pixels in a canvas so you can apply cool effects to the images and shapes you've drawn using the HTML5 Canvas API. This is a lengthy tutorial, but you'll become an expert in pixel manipulation by the end of it! Is this the power you seek? Then, continue reading and unlock your full potential! 🌟
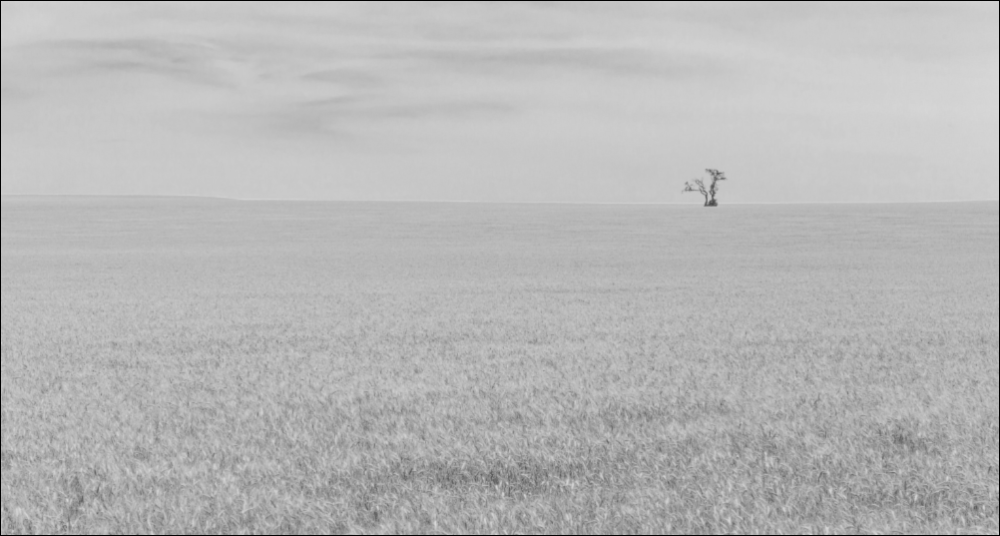
We will be applying image effects to the following photo I retrieved from Unsplash:
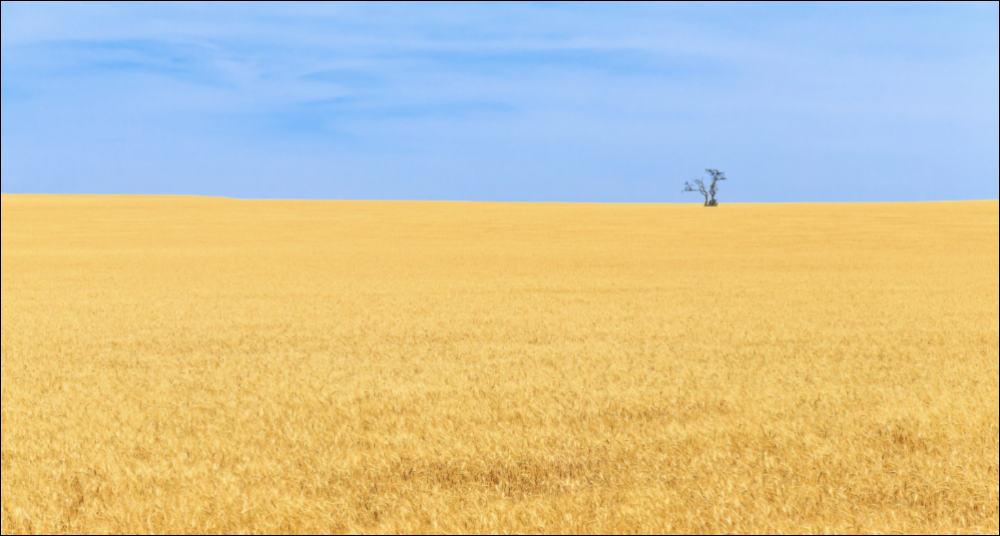
We can use pixel manipulation to make all the wheat fields appear like grass!
For this tutorial, I have created a repo on GitHub. If you would like to follow along, please clone or download this repo as it contains the image we need:
git clone https://github.com/inspirnathan/canvas-tutorial-pixel-manipulation.git
Canvas Setup
For this tutorial, I have taken care of setting up the HTML and CSS for you. Create a file called index.html with the following contents:
<!DOCTYPE html>
<html lang="en">
<head>
  <meta charset="UTF-8">
  <meta name="viewport" content="width=device-width, initial-scale=1.0">
  <title>Pixel Manipulation</title>
  <link rel="stylesheet" href="style.css">
</head>
<body>
  <h1>Pixel Manipulation</h1>
  <div class="row">
    <canvas id="canvas" width="1000" height="535"></canvas>
    <div class="row">
      <div class="column">
        <div>Hovered Color</div>
        <div id="hovered-color" class="color"></div>
      </div>
      <div class="column">
        <div>Selected Color</div>
        <div id="selected-color" class="color"></div>
      </div>
    </div>
  </div>
  <script src="canvas.js"></script>
</body>
</html>
Then, create a file called style.css that will contain all of styling:
#canvas {
  border: 1px solid black;
}

.row {
  display: flex;
}

.row > * {
  margin-right: 1rem;
}

.column {
  border: 1px solid black;
  width: 12rem;
  height: 12rem;
  text-align: center;
  display: flex;
  flex-direction: column;
}

.color {
  display: flex;
  flex: 1 1 100%;
  justify-content: center;
  align-items: center;
}
Create a script called canvas.js with the following contents in the same directory:
const canvas = document.getElementById('canvas')
const ctx = canvas.getContext('2d')

const image = new Image()
image.src = 'wheatfields.jpeg'

image.onload = () => {
  ctx.drawImage(image, 0, 0, canvas.width, canvas.height)
  image.style.display = 'none'
}
You learned in Part 5 of my HTML5 Canvas series that we can use an <img> element to load an image to the DOM, so we can grab it using the Canvas API. We'll take a different approach this time. We'll use JavaScript to create a new image in memory and set the src property equal to the image we have in our root directory. You can find the image in the GitHub repo I posted earlier.
The onload property is another way of attaching the load event listener to the image. We need to wait for the image to be loaded before we can draw the image to the canvas. We set the image's display property to none to make sure we don't see the photo twice, similar to what we added to the <img> element in Part 5.
The ctx.getImageData Method
Before we continue, we need to learn how to use the ctx.getImageData method.
ImageData ctx.getImageData(sx, sy, sWidth, sHeight);
This method takes four parameters and returns an ImageData object that represents the pixel data for a specific portion of the canvas, or the entire canvas if we prefer.
The sx and sy parameters represent the x-axis and y-axis coordinates of the top-left corner of where we want to start extracting our pixel data.
The sWidth and sHeight parameters represent how wide and how high we should make our pixel "selection area". We can choose to grab pixel data from the whole canvas or choose to grab only from a small region such as a 10px by 10px area.
If we run ctx.getImageData on our entire canvas, we'll get a lot of data! Let's update canvas.js to log the output of this method to the console and use the length of the imageData.data array to determine how many values there are.
image.onload = () => {
  ctx.drawImage(image, 0, 0, canvas.width, canvas.height)
  image.style.display = 'none'
  const imageData = ctx.getImageData(0, 0, canvas.width, canvas.height)
  console.log(imageData)
  console.log(imageData.data.length) // 2140000 values!!!
}
In Google Chrome, I receive the following output:
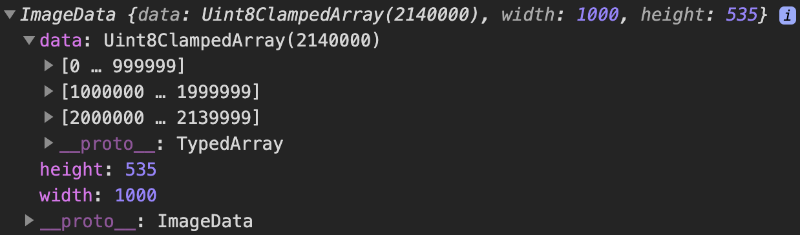
There are 2140000 values in the array! Wow! But, where did this number come from? When we called the ctx.getImageData method, our selection area was the entire canvas. The width of the canvas is 1000 pixels and the height is 535 pixels. If we multiply those together, we get 535000 pixels. Each pixel has 4 values: red, green, blue, and alpha in that order. Therefore, we end up with 535000 x 4 = 2140000 values.
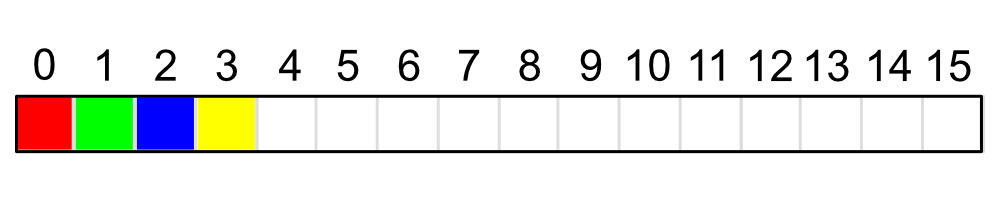
Here is an illustration that may help you visualize what's going on. Imagine a canvas that is 4px by 4px where each color in the top row represents a different pixel. The blue pixel is located at (2, 0). This pixel will have a rgba (red, green, blue, alpha) value of (0, 0, 255, 255). Each value of rgba ranges from 0 to 255 and are integer values. The alpha value represents the opacity of the pixel or how transparent it is. Most drawing software use an alpha value that is a percentage (0% to 100%), but it's done differently in the Canvas API.
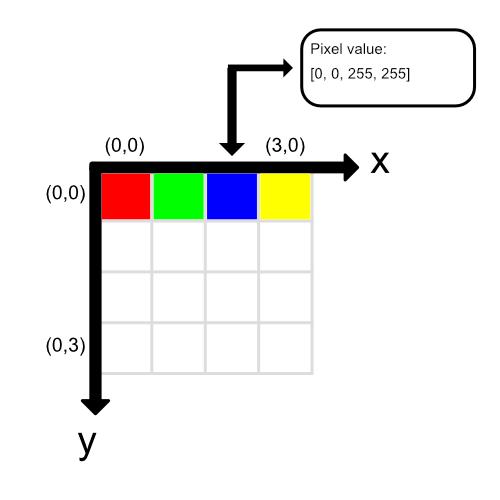
The weird thing you need to understand is that the ctx.getImageData doesn't return a nice matrix where we can easily get values at an (x,y) coordinate. It creates a flat array of values that stack all the pixels side by side.
If we were to look at the first four pixels, we would get these values from the ctx.getImageData method.
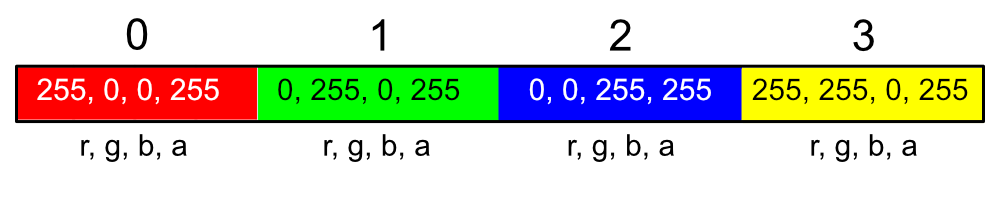
Yes, this seems like a hassle for obtaining pixel values from our images 😩. But, we can create a utility function that makes it much easier to look at the pixel colors in our canvas. Let's return back to the realm of reality and focus on our wheat fields photo inside the canvas we made earlier in this tutorial.
Creating a Color Picker
Still with me? Let's create a color picker, so it's easy to identify colors on our canvas. This will help us figure out how to manipulate groups of pixels all at once later.
In the index.html file I have provided you, I already set up boxes that will hold the values of the colors we select from the canvas. One box will hold the "hovered color" when you move your mouse over the canvas, and the other box will hold the "selected color" when you click on the canvas.
Replace the contents of your canvas.js file with the following:
const canvas = document.getElementById('canvas')
const ctx = canvas.getContext('2d')

const hoveredColor = document.getElementById('hovered-color')
const selectedColor = document.getElementById('selected-color')

const image = new Image()
image.src = 'wheatfields.jpeg'

image.onload = () => {
  ctx.drawImage(image, 0, 0, canvas.width, canvas.height)
  image.style.display = 'none'
}

function pick(event, destination) {
  const x = event.layerX
  const y = event.layerY
  const pixel = ctx.getImageData(x, y, 1, 1)
  const data = pixel.data

  const rgba = `rgba(${data[0]}, ${data[1]}, ${data[2]}, ${data[3]})`
  destination.style.background = rgba
  destination.textContent = rgba

  return rgba
}

canvas.addEventListener('mousemove', (event) => {
  pick(event, hoveredColor)
})

canvas.addEventListener('click', (event) => {
  pick(event, selectedColor)
})
This code will let you visualize each pixel color in the photo of the wheat fields. Notice how the image is mostly blue and yellow. Makes it super easy to replace colors!
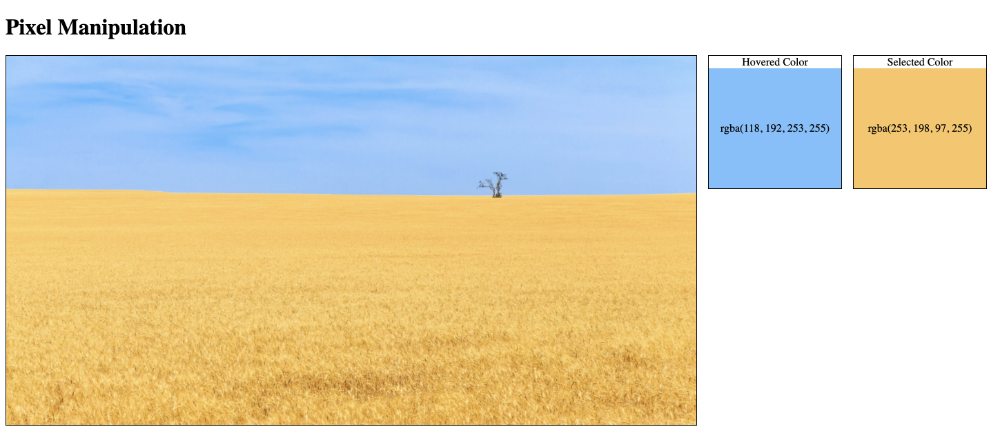
In the code, we are using ctx.getImageData to create a selection area that is only 1px by 1px. The imageData object we get back will contain four values: red, green, blue, and alpha.
The ctx.putImageData Method
Before we start creating cool filter and image effects, we need to learn about the ctx.putImageData method.
void ctx.putImageData(imageData, dx, dy)
void ctx.putImageData(imageData, dx, dy, dirtyX, dirtyY, dirtyWidth, dirtyHeight)
It is an overloaded function used to manipulate pixels on the canvas. We will be focusing on the first function declaration for this tutorial.
The dx and dy parameters correspond to the x-axis and y-axis coordinate at which to place the image data in the destination canvas. The process of creating a filter goes like this: use ctx.getImageData to obtain an imageData object, adjust the pixel values in the imageData.data property, and then insert the manipulated imageData object in the ctx.putImageData method to update the canvas with new pixel data.
The "dirty" values correspond to the x, y, width, and height dimensions of the image data we pass into the method.
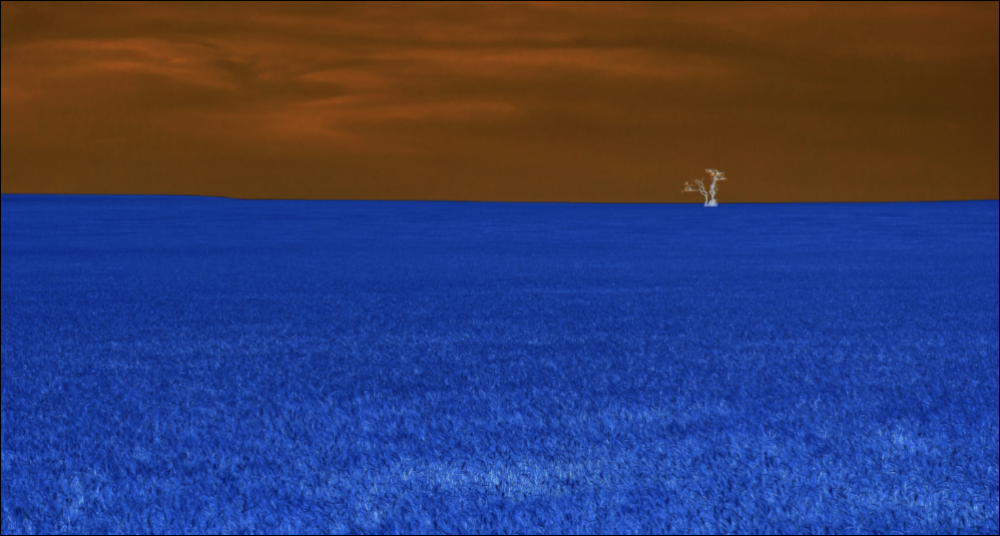
Inverted Images
It's time to start manipulating the pixels in the image! Let's start off with something easy: inverse colors! But, what is an inverse color? Each color can have values between 0 and 255. If we want to "invert" the color, then we need to subtract the pixel color from 255, since that is the max color value.
Below is the completed invert function:
function invert() {
  const imageData = ctx.getImageData(0, 0, canvas.width, canvas.height)
  const data = imageData.data
  for (let i = 0; i < data.length; i += 4) {
    data[i] = 255 - data[i] // red
    data[i + 1] = 255 - data[i + 1] // green
    data[i + 2] = 255 - data[i + 2] // blue
  }
  ctx.putImageData(imageData, 0, 0)
}
Let me explain what's happening here. Earlier, I mentioned that the pixel color values are stacked side by side. That means in our giant array we get back from ctx.getImageData, we should expect a red color every four values, starting at index 0 of our array. The second red value will be at index 4, then 8, and so on. Likewise, the green color starts at index 1, then 5, then 9, and so on. I know it's weird, but that's how the developers designed it 🤷.
We can use a for loop and iterate by 4 to cycle through each of the rgba values. Remember, a pixel contains 4 values. The first pixel of a canvas starts at index 0 of the imageData.data array. The second pixel starts at index 4. The third pixel starts at 8 and so on.
We iterate through every color value in the canvas and subtract it from 255 to produce an inverted color. We can run this function inside the image.onload method in our canvas.js file:
image.onload = () => {
  ctx.drawImage(image, 0, 0, canvas.width, canvas.height)
  image.style.display = 'none'
  invert()
}
We end up with a bizarre, dystopian-looking wheat field. Woah! 😱
Grayscale Images
Grayscale filters, or "black and white" filters, are very easy to create. A gray color is a color where the red, green, and blue values are approximately the same value and lies between black (0, 0, 0) and white (255, 255, 255). To create a grayscale filter, we'll follow a similar approach to the invert function.
function grayscale() {
  const imageData = ctx.getImageData(0, 0, canvas.width, canvas.height)
  const data = imageData.data
  for (let i = 0; i < data.length; i += 4) {
    const avg = (data[i] + data[i + 1] + data[i + 2]) / 3
    data[i] = avg // red
    data[i + 1] = avg // green
    data[i + 2] = avg // blue
  }
  ctx.putImageData(imageData, 0, 0)
}
By taking the average of red, green, and blue values at each pixel, we can get various shades of gray. Let's run the grayscale function inside our image.onload method:
image.onload = () => {
  ctx.drawImage(image, 0, 0, canvas.width, canvas.height)
  image.style.display = 'none'
  grayscale()
}
You should see a blast from the past! It looks like part of a TV show from the 1950s. Totally retro! 😎
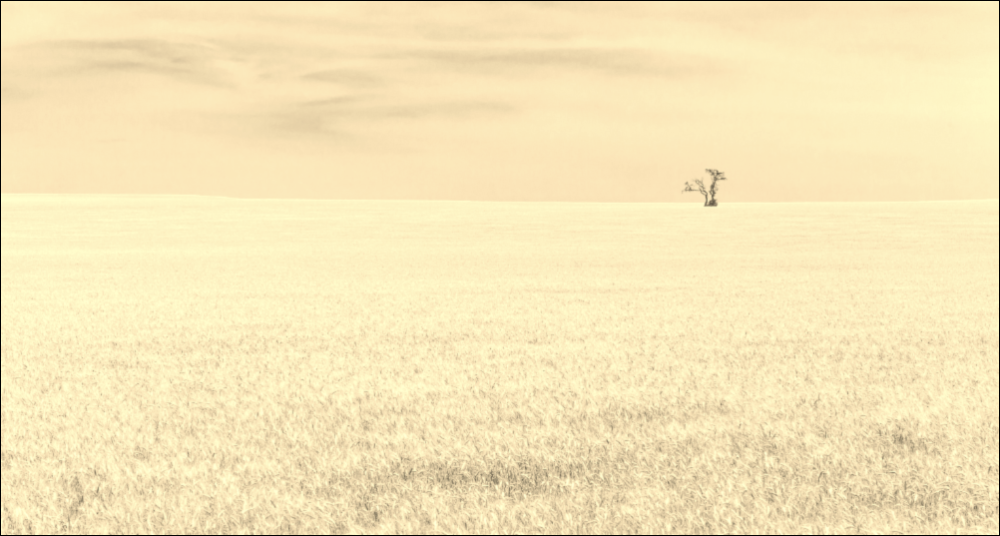
Sepia Images
If you've ever watched the Wizard of Oz, you'll probably recognize the sepia tone. This movie was filmed in black and white. Part of the film was colored in a sepia-tone process that gives it a brownish look, reminiscent of old photos from the 1800s. Photographic print toning was quite an interesting process to make photos look more vibrant!
The sepia filter is a bit difficult to get right on a computer. It's digitally recreating a look that was initially created through a chemical process on black and white photographs. Luckily, MDN provides the code you need to create a sepia filter on their GitHub page. This is also the same place where I found the invert and grayscale functions.
function sepia() {
  const imageData = ctx.getImageData(0, 0, canvas.width, canvas.height)
  const data = imageData.data
  for (let i = 0; i < data.length; i += 4) {
    const red = data[i]
    const green = data[i + 1]
    const blue = data[i + 2]

    data[i] = Math.min(Math.round(0.393 * red + 0.769 * green + 0.189 * blue), 255)
    data[i + 1] = Math.min(Math.round(0.349 * red + 0.686 * green + 0.168 * blue), 255)
    data[i + 2] = Math.min(Math.round(0.272 * red + 0.534 * green + 0.131 * blue), 255)
  }
  ctx.putImageData(imageData, 0, 0)
}
Let's run the sepia function inside our image.onload method:
image.onload = () => {
  ctx.drawImage(image, 0, 0, canvas.width, canvas.height)
  image.style.display = 'none'
  sepia()
}
Another blast from the past! Try applying this filter to other images to see what they would have looked like in the past 😃.
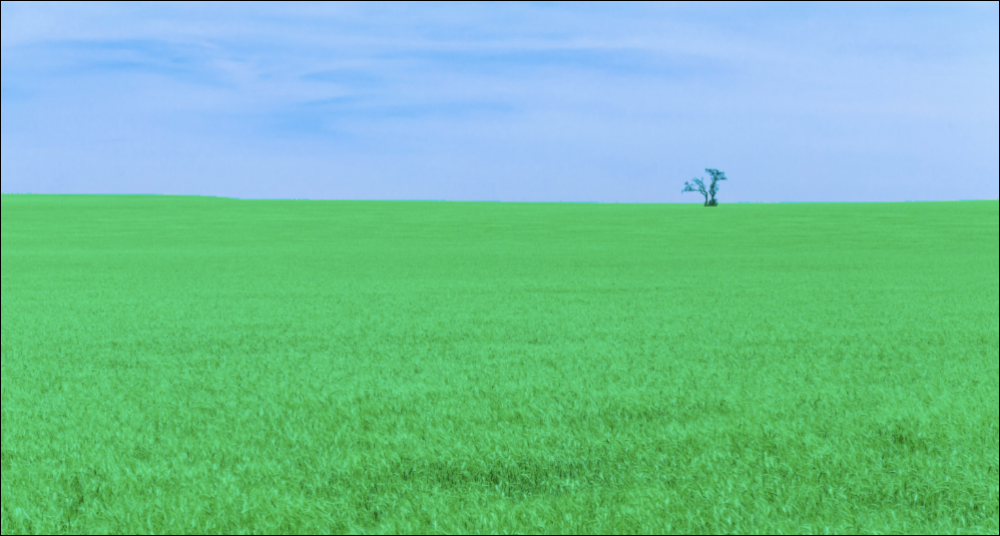
Converting the Wheat to Grass
In the beginning of this tutorial, I mentioned that we could apply a filter that turns the wheat into grass. This is a filter that I wrote that is specifically customized for this photo, but it may work for other images as well.
The reason why I like this photo so much is because you can see a clear boundary between the blue sky and yellow wheat fields.
With such a clear separation of colors, we can replace the yellow with green in all pixels such that their blue value is lower than 240. I used the color picker we created earlier in this tutorial to verify that almost all "sky" pixels had a blue value greater than 240.
We will loop through all pixels like before, but only change yellow pixels to green when the blue part of the pixel is less than 240. But, how do we change yellow pixels to green? In the digital world, yellow is a combination of red and green. By removing the red part, we are left with green.
function convertWheatToGrass() {
  const imageData = ctx.getImageData(0, 0, canvas.width, canvas.height)
  const data = imageData.data
  for (let i = 0; i < data.length; i += 4) {
    if (data[i + 2] < 240)
      data[i] = 0 // remove red color from wheat to make it look like grass
  }
  ctx.putImageData(imageData, 0, 0)
}
Run the convertWheatToGrass function inside our image.onload method:
image.onload = () => {
  ctx.drawImage(image, 0, 0, canvas.width, canvas.height)
  image.style.display = 'none'
  convertWheatToGrass()
}
And now all of the wheat has become a calm green color such that it looks very similar to grass.
Conclusion
Phew! Quite a long tutorial! There are infinite innovative ideas people can create with the HTML5 Canvas API. The filters I mentioned today are super simple. You can use basic digital signal processing algorithms to create convolution filters. These filters can create more advanced effects such as blurring, sharpening, embossing, edge detection, and more! The possibilities are endless!