Interactive Hexagon Grid Tutorial Part 3 - Resizing the Canvas
Greetings, friends! We finally have an interactive hexagon grid working, but why stop there? Up until now, the canvas has been set to the dimensions of 500px by 500px. In this tutorial, we'll learn how to make the hexagon grid adapt to the screen size changes. In particular, we'll look at how to redraw the canvas when the width of the canvas element changes. Let's begin!
Changing the Canvas Width
Instead of hardcoding a value of 500px for the width inside our index.html file, we'll let the browser extend the canvas's width to fit the page.
Let's create a new file called style.css and add the following contents:
canvas {
  border: 1px solid black;
  width: 100%;
  height: 200px;
}
Then, we'll replace the contents of the index.html with the following code:
<!DOCTYPE html>
<html lang="en">
<head>
  <meta charset="UTF-8">
  <meta name="viewport" content="width=device-width, initial-scale=1.0">
  <title>Interactive Hexagon Grid</title>
  <!-- Add the stylesheet -->
  <link rel="stylesheet" href="style.css">
</head>
<body>
  <h1>Canvas API Tutorial</h1>
  <canvas id="canvas"></canvas>
  <script src="canvas.js"></script>
</body>
</html>
Remember! The width attribute of the canvas element is not the same as the width CSS property. The former adjusts the width of the drawn canvas, and the latter adjusts the width of the DOM element. By setting the CSS property, width to 100%, we are telling the browser to stretch the <canvas> element to fill the width of the page.
Let's add the JavaScript code we created in the last tutorial inside canvas.js:
/** @type {HTMLCanvasElement} */
const canvas = document.getElementById("canvas")
const ctx = canvas.getContext("2d")
const canvasRect = canvas.getBoundingClientRect();

const r = 50 // radius
const hexagons = []
let mouseX = null
let mouseY = null


document.addEventListener("mousemove", (e) => {
  mouseX = e.clientX - canvasRect.left
  mouseY = e.clientY - canvasRect.top
})

function lerp(color1, color2, percent) {
  // Clamp the percentage between zero and one
  const t = Math.max(0, Math.min(1, percent));

  // Convert hexadecimal colors to RGB values
  const r1 = Number.parseInt(color1.substring(1, 3), 16)
  const g1 = Number.parseInt(color1.substring(3, 5), 16)
  const b1 = Number.parseInt(color1.substring(5, 7), 16)

  const r2 = Number.parseInt(color2.substring(1, 3), 16)
  const g2 = Number.parseInt(color2.substring(3, 5), 16)
  const b2 = Number.parseInt(color2.substring(5, 7), 16)

  // Linearly Interpolate RGB values
  const r = Math.round(r1 + (r2 - r1) * t)
  const g = Math.round(g1 + (g2 - g1) * t)
  const b = Math.round(b1 + (b2 - b1) * t)

  // Convert interpolated values back to hexadecimal
  return `#${((1 << 24) + (r << 16) + (g << 8) + b).toString(16).slice(1)}`
}

class Hexagon {
  constructor(a, b) {
    this.a = a
    this.b = b
    this.originalColor = '#ffffff'
    this.hoverColor = '#48bb78'
    this.targetColor = '#93e0f0'
    this.currentColor = this.originalColor
    this.isHovered = false
    this.isTouched = false
    this.lerpValue = 0
  }

  draw() {
    ctx.beginPath();
    for (let i = 0; i < 6; i++) {
      ctx.lineTo(
        this.a + r * Math.cos((i * Math.PI) / 3),
        this.b + r * Math.sin((i * Math.PI) / 3)
      )
    }
    ctx.closePath()
    ctx.stroke()
    ctx.fillStyle = this.currentColor
    ctx.fill()
  }

  checkHover() {
      if (mouseX == null || mouseY == null)
        return
      this.isHovered = ctx.isPointInPath(mouseX, mouseY)
      if (this.isHovered)
        this.isTouched = true
    }

  update() {
    if (this.isHovered) {
      this.currentColor = this.hoverColor
      this.lerpValue = 0
    }

    if (this.isTouched) {
      this.lerpValue += 0.02
      this.currentColor = lerp(
        this.hoverColor,
        this.targetColor,
        this.lerpValue
      )
    }
  }
}

function setup() {
  const sizeX = 8
  const sizeY = 13

  for (let i = 0; i < sizeX; i++) {
    for (let j = 0; j < sizeY; j++) {
      if (i % 2 === j % 2) {
        const x = i * 1.5 * r
        const y = j * 0.5 * r * Math.sqrt(3)
        hexagons.push(new Hexagon(x, y))
      }
    }
  }
}

function render() {
  ctx.clearRect(0, 0, canvas.width, canvas.height)

  for (const hexagon of hexagons) {
    hexagon.draw()
    hexagon.checkHover()
    hexagon.update()
  }

  requestAnimationFrame(render)
}

setup()
render()
The hexagon grid should now appear stretched. That is because the default width and height attributes of the <canvas> element are 300px and 150px, respectively, and we told the browser to make the canvas element's box stretch to fit the page.
The DOM's coordinate system is not the same as the canvas's coordinate system built inside the canvas element. Therefore, we need to use JavaScript to set the canvas's true width and height, so the coordinate systems match.
At the top of the setup function in canvas.js, we'll add the following code:
function setup() {
  // Dynamically set the size of the canvas based on the DOM element's width and height
  canvas.width = canvasRect.width
  canvas.height = canvasRect.height

  // ...rest of the setup function code...
}
With this change, the hexagon grid should look normal again! But, if we resize the browser window, the canvas still appears distorted...Let's fix that!
Adding a Resize Event Listener
Since we set the canvas's width and height attributes in the setup function instead of the render, the size is only set when your app initially loads or when you refresh the page. Now we could update the canvas's width and height inside the render function, but then it would get resized many times per second. Instead, it's better to use a resize event handler.
We'll create a new event listener that detects if the browser window has been resized or not. When a resize event occurs, we'll clear the canvas, reset the hexagon state, retrieve new data about the canvas's dimensions, and re-run the setup function.
window.addEventListener('resize', () => {
  ctx.clearRect(0, 0, canvas.width, canvas.height)
  hexagons = []
  canvasRect = canvas.getBoundingClientRect()

  setup()
})
Don't forget to update the const variables to let, since we're now changing them later in our code:
let canvasRect = canvas.getBoundingClientRect();
let hexagons = []
The hexagon grid should look the same as we resize the browser window! But, now we see that the hexagons don't fill up the entire grid. That is because we are still hardcoding a value for both sizeX and sizeY inside the setup function. It's time to make these dynamically change based on the width and height of the canvas.
Filling Hexagons Grids of Dynamic Size
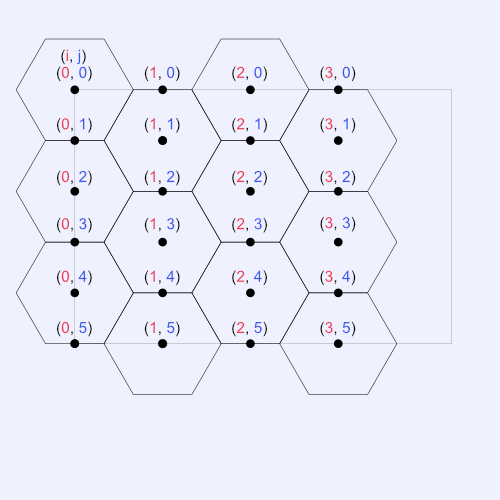
Alright, it's time to go back to some hexagon geometry and math. As mentioned toward the end of Part 1 of this tutorial series, we took the approach of adding points in a rectangular grid pattern. Please see the image below.
We need to figure out how to determine the correct values of sizeX and sizeY such that our canvas is completely filled of hexagons. Along the edges, some hexagons may spill over, but that's okay. We want the canvas to be packed full of hexagons, so that the magical hover effect we made in the previous tutorial is seamless across the whole canvas. Any large gaps may take away from the experience.
A simple way to determine sizeX, the max iteration count in our nested for-loop for drawing the hexagon grid along the x-direction, is to use the following equation:
const sizeX = Math.ceil(canvas.width / (1.5 * r)) + 1
From the image above, we can see that the horizontal distance between each point is equal to 1.5 * r. We therefore divide the canvas width by 1.5 * r, take the ceiling of the number. We then add one to the result because our nested for loop uses i < sizeX instead of i <= sizeX, but that's an easy fix.
For determining sizeY, we can perform a similar calculation:
const sizeY = Math.ceil(canvas.height / (0.5 * r * Math.sqrt(3))) + 1
The vertical distance between points in the image above is equal to 0.5 * r * Math.sqrt(3). We then take the ceiling of this number and add one, similar to sizeX.
To remove the + 1 at the end of the sizeX and sizeY equations, we can simply update < to <=:
function setup() {
  canvas.width = canvasRect.width
  canvas.height = canvasRect.height

  const sizeX = Math.ceil((canvas.width) / (1.5 * r))
  const sizeY = Math.ceil((canvas.height) / (0.5 * r * Math.sqrt(3)))

  for (let i = 0; i <= sizeX; i++) {
    for (let j = 0; j <= sizeY; j++) {
      if (i % 2 === j % 2) {
        const x = i * 1.5 * r
        const y = j * 0.5 * r * Math.sqrt(3)
        hexagons.push(new Hexagon(x, y))
      }
    }
  }
}
With these changes implemented, we should have the following code:
/** @type {HTMLCanvasElement} */
const canvas = document.getElementById("canvas")
const ctx = canvas.getContext("2d")
let canvasRect = canvas.getBoundingClientRect();

const r = 50 // radius
let hexagons = []
let mouseX = null
let mouseY = null


document.addEventListener("mousemove", (e) => {
  mouseX = e.clientX - canvasRect.left
  mouseY = e.clientY - canvasRect.top
})

window.addEventListener('resize', () => {
  ctx.clearRect(0, 0, canvas.width, canvas.height)
  hexagons = []
  canvasRect = canvas.getBoundingClientRect()

  setup()
})

function lerp(color1, color2, percent) {
  // Clamp the percentage between zero and one
  const t = Math.max(0, Math.min(1, percent));

  // Convert hexadecimal colors to RGB values
  const r1 = Number.parseInt(color1.substring(1, 3), 16)
  const g1 = Number.parseInt(color1.substring(3, 5), 16)
  const b1 = Number.parseInt(color1.substring(5, 7), 16)

  const r2 = Number.parseInt(color2.substring(1, 3), 16)
  const g2 = Number.parseInt(color2.substring(3, 5), 16)
  const b2 = Number.parseInt(color2.substring(5, 7), 16)

  // Linearly Interpolate RGB values
  const r = Math.round(r1 + (r2 - r1) * t)
  const g = Math.round(g1 + (g2 - g1) * t)
  const b = Math.round(b1 + (b2 - b1) * t)

  // Convert interpolated values back to hexadecimal
  return `#${((1 << 24) + (r << 16) + (g << 8) + b).toString(16).slice(1)}`
}

class Hexagon {
  constructor(a, b) {
    this.a = a
    this.b = b
    this.originalColor = '#ffffff'
    this.hoverColor = '#48bb78'
    this.targetColor = '#93e0f0'
    this.currentColor = this.originalColor
    this.isHovered = false
    this.isTouched = false
    this.lerpValue = 0
  }

  draw() {
    ctx.beginPath();
    for (let i = 0; i < 6; i++) {
      ctx.lineTo(
        this.a + r * Math.cos((i * Math.PI) / 3),
        this.b + r * Math.sin((i * Math.PI) / 3)
      )
    }
    ctx.closePath()
    ctx.stroke()
    ctx.fillStyle = this.currentColor
    ctx.fill()
  }

  checkHover() {
      if (mouseX == null || mouseY == null)
        return
      this.isHovered = ctx.isPointInPath(mouseX, mouseY)
      if (this.isHovered)
        this.isTouched = true
    }

  update() {
    if (this.isHovered) {
      this.currentColor = this.hoverColor
      this.lerpValue = 0
    }

    if (this.isTouched) {
      this.lerpValue += 0.02
      this.currentColor = lerp(
        this.hoverColor,
        this.targetColor,
        this.lerpValue
      )
    }
  }
}

function setup() {
  canvas.width = canvasRect.width
  canvas.height = canvasRect.height

  const sizeX = Math.ceil(canvas.width / (1.5 * r))
  const sizeY = Math.ceil(canvas.height / (0.5 * r * Math.sqrt(3)))

  for (let i = 0; i <= sizeX; i++) {
    for (let j = 0; j <= sizeY; j++) {
      if (i % 2 === j % 2) {
        const x = i * 1.5 * r
        const y = j * 0.5 * r * Math.sqrt(3)
        hexagons.push(new Hexagon(x, y))
      }
    }
  }
}

function render() {
  ctx.clearRect(0, 0, canvas.width, canvas.height)

  for (const hexagon of hexagons) {
    hexagon.draw()
    hexagon.checkHover()
    hexagon.update()
  }

  requestAnimationFrame(render)
}

setup()
render()
Identifying Completely Touched Canvases
When I was making the interactive hexagon grid for the front page of my website, I had to consider having too many hexagons past the edges of the canvas. If too many hexagons spill over the edges, then the user might not be able to see them. If your goal is to simply show an interactive grid of hexagons, then you really don't need to be concerned about that. In fact, you're basically done! You can stop here, or you can continue reading for fun 🙂
On my website, I play a special animation when the user hovers over all the hexagons. Therefore, I need to make sure the user can actually see and touch all the hexagons that are visible in the canvas. If there are secret hexagons outside the canvas, it may get annoying, or the user may think nothing special happens, and my hexagons are lame 😅
In order to see some of the issues I'm referring to, let's make our canvas smaller to really zoom in on the details. Inside our style.css file, we can temporarily change the width of the canvas to 240px.
canvas {
  border: 1px solid black;
  width: 240px;
  height: 200px;
}
Then, we'll add the following a console log at the very end of the setup function to display how many hexagons have been drawn.
function setup() {
  // ...rest of the setup function code...

  console.log('Total hexagons: ', hexagons.length)
}
We'll also add a circle to represent the center hexagon points, similar to what we did in Part 1 of this tutorial series. Create a new method inside the Hexagon class called drawCenter with the following contents:
class Hexagon {
  // ...rest of the Hexagon code...

  drawCenter() {
    ctx.beginPath();
    ctx.arc(this.a, this.b, r * 0.1, 0, 2 * Math.PI);
    ctx.fillStyle = "#000000";
    ctx.fill();
  }
}
Then, we'll update the render function to invoke every hexagon's drawCenter method.
function render() {
  ctx.clearRect(0, 0, canvas.width, canvas.height);

  for (const hexagon of hexagons) {
    hexagon.draw();
    hexagon.checkHover();
    hexagon.update();
    hexagon.drawCenter(); // <-- draw center points of hexagons
  }

  requestAnimationFrame(render);
}
Our canvas.js file should now look like the following:
/** @type {HTMLCanvasElement} */
const canvas = document.getElementById("canvas")
const ctx = canvas.getContext("2d")
let canvasRect = canvas.getBoundingClientRect();

const r = 50 // radius
let hexagons = []
let mouseX = null
let mouseY = null


document.addEventListener("mousemove", (e) => {
  mouseX = e.clientX - canvasRect.left
  mouseY = e.clientY - canvasRect.top
})

window.addEventListener('resize', () => {
  ctx.clearRect(0, 0, canvas.width, canvas.height)
  hexagons = []
  canvasRect = canvas.getBoundingClientRect()

  setup()
})

function lerp(color1, color2, percent) {
  // Clamp the percentage between zero and one
  const t = Math.max(0, Math.min(1, percent));

  // Convert hexadecimal colors to RGB values
  const r1 = Number.parseInt(color1.substring(1, 3), 16)
  const g1 = Number.parseInt(color1.substring(3, 5), 16)
  const b1 = Number.parseInt(color1.substring(5, 7), 16)

  const r2 = Number.parseInt(color2.substring(1, 3), 16)
  const g2 = Number.parseInt(color2.substring(3, 5), 16)
  const b2 = Number.parseInt(color2.substring(5, 7), 16)

  // Linearly Interpolate RGB values
  const r = Math.round(r1 + (r2 - r1) * t)
  const g = Math.round(g1 + (g2 - g1) * t)
  const b = Math.round(b1 + (b2 - b1) * t)

  // Convert interpolated values back to hexadecimal
  return `#${((1 << 24) + (r << 16) + (g << 8) + b).toString(16).slice(1)}`
}

class Hexagon {
  constructor(a, b) {
    this.a = a
    this.b = b
    this.originalColor = '#ffffff'
    this.hoverColor = '#48bb78'
    this.targetColor = '#93e0f0'
    this.currentColor = this.originalColor
    this.isHovered = false
    this.isTouched = false
    this.lerpValue = 0
  }

  draw() {
    ctx.beginPath();
    for (let i = 0; i < 6; i++) {
      ctx.lineTo(
        this.a + r * Math.cos((i * Math.PI) / 3),
        this.b + r * Math.sin((i * Math.PI) / 3)
      )
    }
    ctx.closePath()
    ctx.stroke()
    ctx.fillStyle = this.currentColor
    ctx.fill()
  }

  checkHover() {
      if (mouseX == null || mouseY == null)
        return
      this.isHovered = ctx.isPointInPath(mouseX, mouseY)
      if (this.isHovered)
        this.isTouched = true
    }

  update() {
    if (this.isHovered) {
      this.currentColor = this.hoverColor
      this.lerpValue = 0
    }

    if (this.isTouched) {
      this.lerpValue += 0.02
      this.currentColor = lerp(
        this.hoverColor,
        this.targetColor,
        this.lerpValue
      )
    }
  }

  drawCenter() {
    ctx.beginPath();
    ctx.arc(this.a, this.b, r * 0.1, 0, 2 * Math.PI);
    ctx.fillStyle = "#000000";
    ctx.fill();
  }
}

function setup() {
  canvas.width = canvasRect.width
  canvas.height = canvasRect.height

  const sizeX = Math.ceil(canvas.width / (1.5 * r))
  const sizeY = Math.ceil(canvas.height / (0.5 * r * Math.sqrt(3)))

  for (let i = 0; i <= sizeX; i++) {
    for (let j = 0; j <= sizeY; j++) {
      if (i % 2 === j % 2) {
        const x = i * 1.5 * r
        const y = j * 0.5 * r * Math.sqrt(3)
        hexagons.push(new Hexagon(x, y))
      }
    }
  }

  console.log('Total hexagons: ', hexagons.length)
}

function render() {
  ctx.clearRect(0, 0, canvas.width, canvas.height);

  for (const hexagon of hexagons) {
    hexagon.draw();
    hexagon.checkHover();
    hexagon.update();
    hexagon.drawCenter();
  }

  requestAnimationFrame(render);
}

setup()
render()
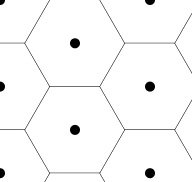
After refreshing the page, we should see that our canvas looks like the following:
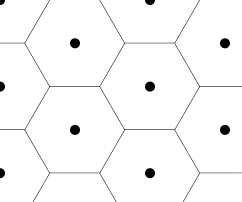
If we count the hexagons in the canvas, we'll find that there are 12 hexagons visible. However, our console log is reporting 15 hexagons. Why? This is due to how we constructed the mathematical expressions for the sizeX and sizeY variables in our setup function. Let's inspect it more closely.
function setup() {
  canvas.width = canvasRect.width
  canvas.height = canvasRect.height

  const sizeX = Math.ceil(canvas.width / (1.5 * r))
  const sizeY = Math.ceil(canvas.height / (0.5 * r * Math.sqrt(3)))

  for (let i = 0; i <= sizeX; i++) {
    for (let j = 0; j <= sizeY; j++) {
      if (i % 2 === j % 2) {
        const x = i * 1.5 * r
        const y = j * 0.5 * r * Math.sqrt(3)
        hexagons.push(new Hexagon(x, y))
      }
    }
  }

  console.log('Total hexagons: ', hexagons.length)
}
Let's calculate the values for sizeX and sizeY given a canvas width of 240px, height of 200px, and a radius of 50.
const r = 50
const width = 240
const height = 200
const sizeX = Math.ceil(width / (1.5 * r))
const sizeY = Math.ceil(height / (0.5 * r * Math.sqrt(3)))

console.log(sizeX) // 4
console.log(sizeY) // 5
We can see that sizeX equals 4 and sizeY equals 5, but what do these values tell us? If we look at the nested for loop that draws the hexagon grid, we can see that our code looks like the following:
for (let i = 0; i <= sizeX; i++) {
  for (let j = 0; j <= sizeY; j++) {
    if (i % 2 === j % 2) {
      const x = i * 1.5 * r
      const y = j * 0.5 * r * Math.sqrt(3)
      hexagons.push(new Hexagon(x, y))
    }
  }
}
Remember, in the previous tutorials, we were using i < size and y < sizeY, but now we're using i <= sizeX and j <= sizeY because it let us avoid adding a + 1 add the end of sizeX and sizeY.
As the code stands right now, if sizeX equals 4, then we'd expect the outer loop to run 5 times. If sizeY equals 5, then we'd expect the inner loop to run 6 times.
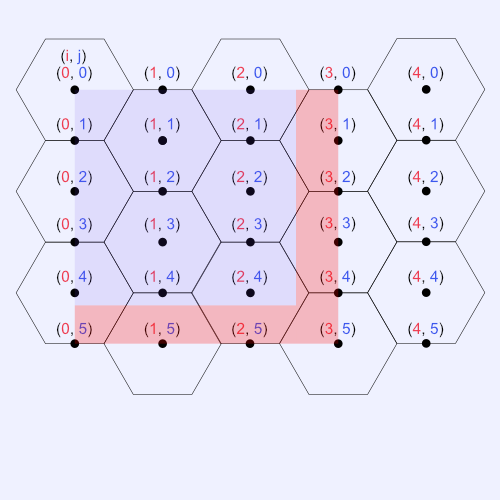
The image below should help visualize what's going on. In the image, each coordinate represents the center points of each hexagon relative to the i and j indices. The blue box represents the visible portion of our canvas. The red box indicates the invisible portion of the canvas.
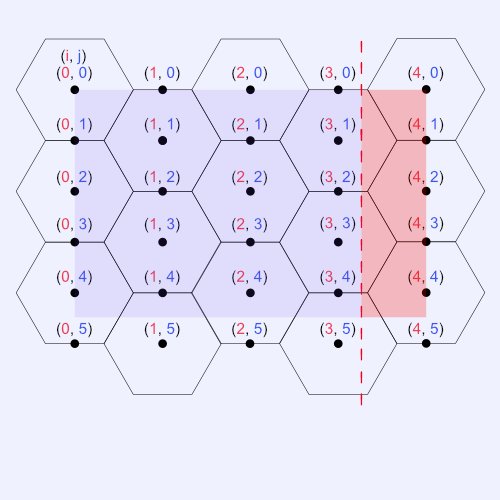
In our nested for-loop, we only draw hexagons when both i and j are even or when both of them are odd. That is, we only care about drawing hexagons when (i, j) lands on the center of the hexagon, not on the edges.
Notice how there are completely full hexagons being drawn outside of the canvas. Since sizeX goes up to 4 (inclusive), then we are drawing three extra hexagons to the right of the canvas. This is why we end up with 15 hexagons instead of 12.
Since our mousemove event listener was added to the document instead of the canvas, the user can still technically hover over these "invisible" hexagons even if they're not visible, but we want the interactive hexagon grid experience to be perfect, or at least have the appearance of perfection 😉
In order to resolve our issue, we need to make some changes to how we calculate sizeX and sizeY. There are multiple ways we can solve this problem. If we constrained the width and height, then it's trivial to make calculations to ensure all hexagons are both visible and interactable. It's tricky when the canvas can change to any size.
I'll discuss an implementation that seems to work for most use cases. My use case is a bit fine-tuned for my website, but I'll explain some approaches that can help. Feel free to explore other techniques as well. In my implementation, I keep the very first hexagon (the one at top-left corner) at (0, 0).
I don't shift the canvas to the right or left at all. I only cutoff the canvas on the right side and draw as many hexagons as are visible in the canvas. I also keep the height static and change the radius of the hexagons when the width decreases past a certain threshold.
The main thing to pay attention to is the part of the hexagon where it has a slope along the boundary between two hexagons. These small edges can cause problems for identifying how many hexagons are truly visible in the canvas.
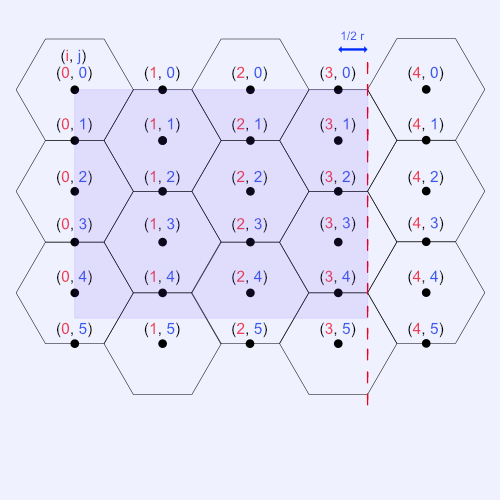
The trick is to divide the canvas width by 1.5 * r like before, but we're going to extract both the integer and fractional part of this result within the setup function.
const sizeXSlice = canvas.width / (1.5 * r)
const sizeXInt = Math.floor(sizeXSlice)
const sizeXFrac = sizeXSlice % 1
Looking at the image above, the distance between the center point of a hexagon and the part of the hexagon that starts sloping is equal to 0.5 * r. This is equal to one third of 1.5 * r. Remember, we are dividing the whole canvas by 1.5 * r. The remainder tells us how many leftover hexagons we should draw. Therefore, our sizeX value should change depending on whether the right edge of the canvas is less than 1/3 or greater than 1/3.
const sizeXSlice = canvas.width / (1.5 * r)
const sizeXInt = Math.floor(sizeXSlice)
const sizeXFrac = sizeXSlice % 1
let sizeX = sizeXInt

if (sizeXFrac > 1 / 3) {
  sizeX = sizeXInt + 1
}
To provide a bit more buffer, I find that 0.35 works a bit better (and also results in one less computation we have to do).
const sizeXSlice = canvas.width / (1.5 * r)
const sizeXInt = Math.floor(sizeXSlice)
const sizeXFrac = sizeXSlice % 1
let sizeX = sizeXInt

if (sizeXFrac > 0.35) {
  sizeX = sizeXInt + 1
}
If we run our code with our new sizeX value, then we should now see that the console is logging 12 total hexagons instead of 15. Success!
When resizing the canvas, you may notice there are other occasions where the hexagons might not be visible. For instance, suppose we set the width of the canvas is set to 190px, the height is set to 180px, and the radius is set to 50.
The canvas will look like the following:
Our total hexagon count will mistakenly say 12, but only 11 hexagons are visible. That is because the hexagon in the bottom-right corner of the hexagon grid is cutoff from view.
As we can see in the image above, the red box represents the part of the hexagon grid invisible to the user. The hexagon on the bottom-right corner is missing from view. When originally designing my interactive hexagon grid, the bottom-right corner hexagon gave me the most trouble. We could use some math to prevent them from being drawn. I use the following trick in the setup function:
for (let i = 0; i <= sizeX; i++) {
  for (let j = 0; j <= sizeY; j++) {
    if (i % 2 === j % 2) {
      const x = i * 1.5 * r;
      const y = j * 0.5 * r * Math.sqrt(3);

      // If the very last hexagon is hard to see on even-numbered columns (due to the canvas border), then exclude the hexagon from the list
      if (canvas.width - (x - r) < 20 && j === sizeY) continue;

      hexagons.push(new Hexagon(x, y));
    }
  }
}
The leftmost point on a hexagon is equal to x - r where x is the x-coordinate of the center point of a hexagon. When the last hexagon is hard to see on even-numbered columns, we can check if the leftmost point is a certain distance away from the canvas edge. If so, then we skip drawing the hexagon.
I also prefer to keep the height at a constant size for my website, and I change the radius of the hexagons depending on the screen size. I found a height where hexagons are least likely to be hidden for most canvas widths.
We can make the radius, r, a let variable instead of const at the top of our canvas.js file, and the insert the following code into our setup function.
function setup() {
  if (window.innerWidth < 640)
    r = 65
  else
    r = 50

  // ...rest of the setup function code...
}
Once your hexagon grid is fine-tuned to your liking, you can now count the number of hexagons and do something special when the user has highlighted over all the hexagons. Yay! 🎉
Here's a small function called checkHexagonStatus for counting all the hexagons in the canvas:
function checkHexagonStatus() {
  return hexagons.every((hexagon) => hexagon.isTouched);
}
We can make this check at the end of the render function. We'll simply console log a celebratory message, but feel free to play fun animations or whatever you'd like! 🙂
function render() {
  ctx.clearRect(0, 0, canvas.width, canvas.height);

  for (let hexagon of hexagons) {
    hexagon.draw();
    hexagon.checkHover();
    hexagon.update();
    hexagon.drawCenter();
  }

  if (checkHexagonStatus()) {
    console.log('All hexagons found! Yay! 🎉🎉🎉');
  }

  requestAnimationFrame(render);
}
On my website, I make a check every frame to see if all hexagons have an isTouched property set to true. If so, then I make party poppers appear and make it look like confetti shoots out of them. If you want to see how I created fun confetti animations, please see my CodePen! It contains all the tricks I mentioned in this tutorial for making sure the users can always see a message appear when they've highlighted all the hexagons regardless of the canvas size. I hopefully covered all edge cases 😅
Finished Code
Make sure to change your canvas's width back to 100% in the style.css file.
canvas {
  border: 1px solid black;
  width: 100%;
  height: 200px;
}
Please see the finished code for canvas.js below:
/** @type {HTMLCanvasElement} */
const canvas = document.getElementById("canvas");
const ctx = canvas.getContext("2d");
let canvasRect = canvas.getBoundingClientRect();

let r = 50; // radius
let hexagons = [];
let mouseX = null;
let mouseY = null;

document.addEventListener("mousemove", (e) => {
  mouseX = e.clientX - canvasRect.left;
  mouseY = e.clientY - canvasRect.top;
});

window.addEventListener("resize", () => {
  ctx.clearRect(0, 0, canvas.width, canvas.height);
  hexagons = [];
  canvasRect = canvas.getBoundingClientRect();

  setup();
});

function lerp(color1, color2, percent) {
  // Clamp the percentage between zero and one
  const t = Math.max(0, Math.min(1, percent));

  // Convert hexadecimal colors to RGB values
  const r1 = Number.parseInt(color1.substring(1, 3), 16);
  const g1 = Number.parseInt(color1.substring(3, 5), 16);
  const b1 = Number.parseInt(color1.substring(5, 7), 16);

  const r2 = Number.parseInt(color2.substring(1, 3), 16);
  const g2 = Number.parseInt(color2.substring(3, 5), 16);
  const b2 = Number.parseInt(color2.substring(5, 7), 16);

  // Linearly Interpolate RGB values
  const r = Math.round(r1 + (r2 - r1) * t);
  const g = Math.round(g1 + (g2 - g1) * t);
  const b = Math.round(b1 + (b2 - b1) * t);

  // Convert interpolated values back to hexadecimal
  return `#${((1 << 24) + (r << 16) + (g << 8) + b).toString(16).slice(1)}`;
}

class Hexagon {
  constructor(a, b) {
    this.a = a;
    this.b = b;
    this.originalColor = "#ffffff";
    this.hoverColor = "#48bb78";
    this.targetColor = "#93e0f0";
    this.currentColor = this.originalColor;
    this.isHovered = false;
    this.isTouched = false;
    this.lerpValue = 0;
  }

  draw() {
    ctx.beginPath();
    for (let i = 0; i < 6; i++) {
      ctx.lineTo(
        this.a + r * Math.cos((i * Math.PI) / 3),
        this.b + r * Math.sin((i * Math.PI) / 3)
      );
    }
    ctx.closePath();
    ctx.stroke();
    ctx.fillStyle = this.currentColor;
    ctx.fill();
  }

  drawCenter() {
    ctx.beginPath();
    ctx.arc(this.a, this.b, r * 0.1, 0, 2 * Math.PI);
    ctx.fillStyle = "#000000";
    ctx.fill();
  }

  checkHover() {
    if (mouseX == null || mouseY == null) return;
    this.isHovered = ctx.isPointInPath(mouseX, mouseY);
    if (this.isHovered) this.isTouched = true;
  }

  update() {
    if (this.isHovered) {
      this.currentColor = this.hoverColor;
      this.lerpValue = 0;
    }

    if (this.isTouched) {
      this.lerpValue += 0.02;
      this.currentColor = lerp(
        this.hoverColor,
        this.targetColor,
        this.lerpValue
      );
    }
  }
}

function setup() {
  canvas.width = canvasRect.width;
  canvas.height = canvasRect.height;

  if (window.innerWidth < 640) r = 65;
  else r = 50;

  const sizeXSlice = canvas.width / (1.5 * r);
  const sizeXInt = Math.floor(sizeXSlice);
  const sizeXFrac = sizeXSlice % 1;
  let sizeX = sizeXInt;

  if (sizeXFrac > 1 / 3) {
    sizeX = sizeXInt + 1;
  }

  const sizeY = Math.ceil(canvas.height / (0.5 * r * Math.sqrt(3)));

  for (let i = 0; i <= sizeX; i++) {
    for (let j = 0; j <= sizeY; j++) {
      if (i % 2 === j % 2) {
        const x = i * 1.5 * r;
        const y = j * 0.5 * r * Math.sqrt(3);

        if (canvas.width - (x - r) < 20 && j === sizeY) continue;

        hexagons.push(new Hexagon(x, y));
      }
    }
  }

  console.log("Total hexagons: ", hexagons.length);
}

function checkHexagonStatus() {
  return hexagons.every((hexagon) => hexagon.isTouched);
}

function render() {
  ctx.clearRect(0, 0, canvas.width, canvas.height);

  for (let hexagon of hexagons) {
    hexagon.draw();
    hexagon.checkHover();
    hexagon.update();
    // hexagon.drawCenter(); // uncomment this line to see hexagon center points
  }

  if (checkHexagonStatus()) {
    console.log('All hexagons found! Yay! 🎉🎉🎉');
  }

  requestAnimationFrame(render);
}

setup();
render();
Conclusion
That's it, friends! You did it! You can now make an interactive hexagon grid that plays a special event, animation, or whatever you want when the user hovers over every hexagon 🎉
But, what if I told you we could make the interactive hexagon grid faster and more powerful? 🤯
In the next tutorial, we'll take an entirely different approach to drawing hexagons by creating a fragment shader inside a WebGL canvas instead of drawing to a 2D canvas. Together with Three.js, we'll create a brand new interactive hexagon grid using WebGL and render textures. Go beyond! Plus ultra! ⭐