Using Chrome DevTools with Android Device or Emulator
Greetings, friends! In this article, I'd like to discuss how to debug websites you visit on an Android device or Android emulator using Chrome DevTools! Have you ever wanted to manipulate the height of an element and see how it looks on an Android device in real time? Well, it's totally possible! Let's see how!
Connecting a Physical Android Device to a Computer
Please follow the steps in my previous article by clicking here to learn how to connect an Android device to a computer using Wi-Fi or a USB cable.
Using an Android Emulator
If you would like to use an Android emulator instead of a physical device, then follow the steps here to learn how to download Android Studio and run an emulator. Once you have an emulator running, Chrome will automatically find it. Much less effort than setting up a physical Android device!
Inspect Devices Using Chrome
Once you have connected your device to your computer successfully, go to the following URL in your Google Chrome browser:
chrome://inspect/#devices
You should see a list of all of your connected devices. In my case, I'm using an Android simulator. If you don't see your physical device appear, then that means your device might not be paired properly with your computer. Android emulators should pair by default.
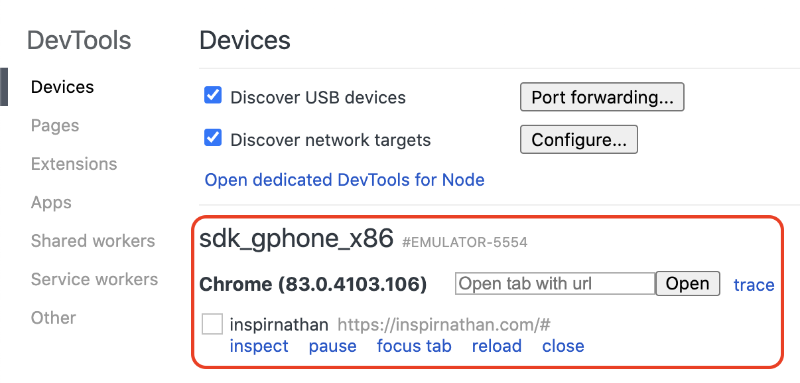
Notice that in the image above, I have a few options available: inspect, pause, focus tab, reload, and close. To see these options appear, we first need to make sure we have Chrome opened in the Android device or emulator. You can either use the search box, as seen in the image above, to navigate to a URL, or you can navigate to a URL directly from Chrome in your Android device or emulator.
If we click on "inspect," then it will open up developer tools in the URL you specified. Try using the URL of my website or common websites you visit. You can alter text and have the changes appear on your Android device or emulator in real time!
If you want to access localhost of a server running on your computer inside an Android emulator or physical Android device, please continue reading the next couple sections.
Accessing Localhost inside Android Emulators
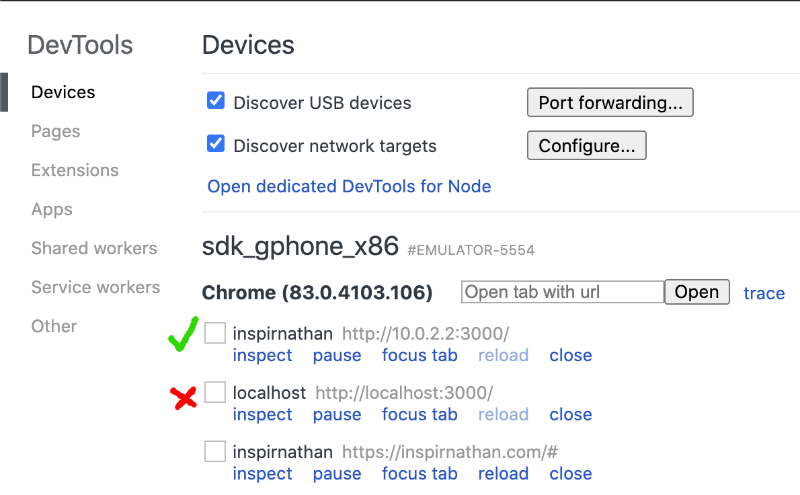
You can debug websites running locally on your computer using Chrome DevTools and an Android emulator. However, as mentioned in my article on accessing localhost inside an Android emulator, you'll have to use 10.0.2.2:PORT instead of localhost:PORT if you're using an Android emulator. Otherwise, the page will fail to load when you click on "inspect."
Accessing Localhost inside Physical Android Device
If you're using a physical Android device and want to access a web app running on localhost of your computer, then it's a bit trickier. You'll need to make sure that your web server is started on 0.0.0.0:PORT instead of localhost/loopback (127.0.0.1). Using the 0.0.0.0 address allows your sever to be accessible to connections outside of the host machine such as your local area network (LAN). This also means you need to make sure that your Android device is connected to the same network as the computer running the server you're trying to reach.
Most servers you run locally are started on 127.0.0.1:PORT, where 127.0.0.1 normally corresponds to localhost. If you visit 127.0.0.1:3000 instead of localhost:3000 and your server is running on port 3000, then you're taken to the same place (unless you've done weird modifications to your computer's networking interfaces 🤪).
If you're using a framework such as Vue.js or Nuxt.js, then you'll need to do a quick search online to figure out how to change the server to run on 0.0.0.0 instead of localhost, since localhost is typically the default.
Once your server is exposed over LAN using 0.0.0.0, then you need to figure out the IP address of your computer. On a Mac, you can use the following command:
ipconfig getifaddr en0
If this command returns nothing, then try using the "en1" network interface instead of "en0" to see if the command outputs your computer's IP address.
On Windows, you can run this command:
ipconfig | findstr /R /C:"IPv4 Address"
Once you have the IP address of your computer, then you can go back to your Android device and enter a URL in Google Chrome with the following structure:
YOUR_COMPUTERS_IP_ADDRESS:PORT
As an example, it may look something like this:
192.168.1.1:3000
Then, your website running locally on your computer should be visible on your physical Android device! 🎉
Conclusion
Hopefully, this article and all my previous articles have helped you debug websites in Android using Chrome DevTools. Please share this with your friends and coworkers! If you're feeling charitable, please donate to my cause! I enjoy making tutorials, but I need your support! If you have any questions, follow and message me on Twitter! May your coding skills bring you lifelong success! 🌟