Debug Node.js Apps with Chrome DevTools
Greetings, friends! Tired of debugging Node.js apps using console.log statements everywhere? Wishing there was an easier way? Indeed there is with the built-in Node.js debugger in Chrome DevTools!
Let's create a small Node.js script called main.js with the following contents:
const ingredients = ['apple', 'pecan', 'chocolate', 'pumpkin']

const pies = ingredients.map(ingredient => `${ingredient} pie`)

console.log(pies)
Normally, we would run the Node.js script like so:
node main.js
When running a Node.js script, you can also exclude the file extension if you prefer:
node main
If we want to attach the debugger, we would run the following command:
node --inspect-brk main
When you run this command, you should see something like the following in your terminal:
Debugger listening on ws://127.0.0.1:9229/e0d92359-c890-4ca0-8f2e-e80137946f11
For help, see: https://nodejs.org/en/docs/inspector
Debugger attached.
If you go to the Google Chrome browser and open up DevTools, you should now see a green Node.js icon magically appear ✨.
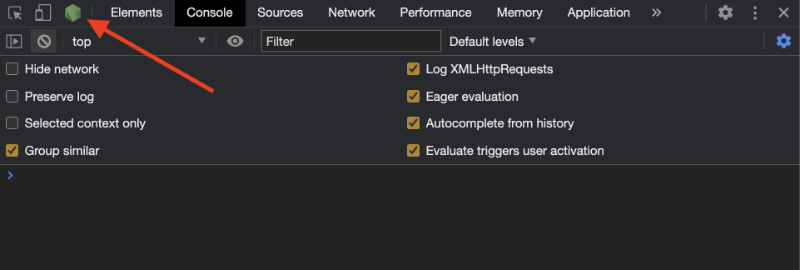
If you click on this icon, you can open up the Node.js debugger within Google Chrome.
As an alternative way to open up the Node.js debugger, you can enter the following in the URL address bar of Google Chrome, and it will take you to the Chrome device inspector.
chrome://inspect
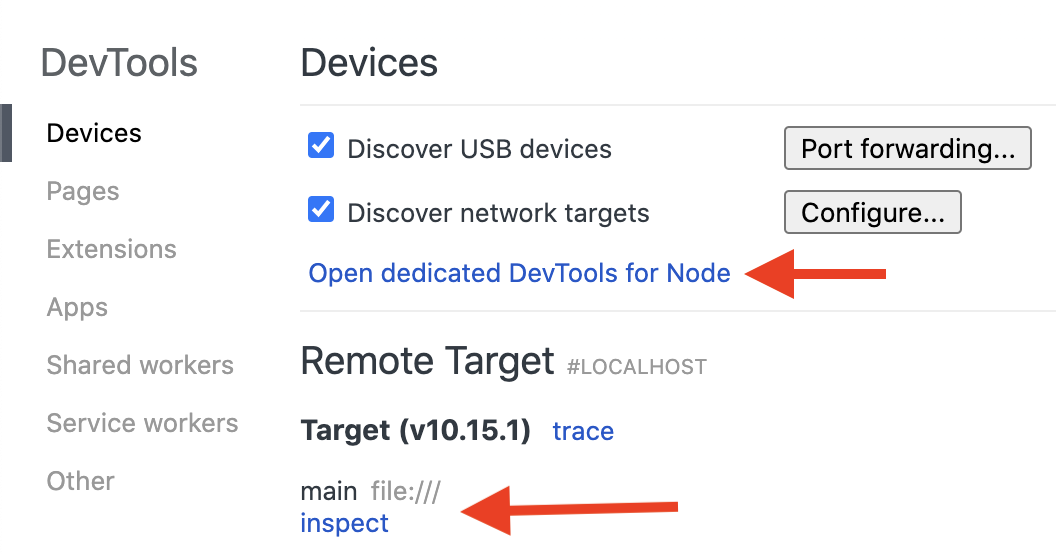
As shown in the image above, there are two hyperlinks you can click on to open the Node.js debugger. You can click on "inspect" or "open dedicated DevTools for Node."
Once you have the Node.js debugger open, you can insert breakpoints just as you would when debugging client-side JavaScript applications. You'll also be able to see the output of console.log statements appear in the Chrome DevTools console as well as in your terminal.
One important thing I should mention is that the --inspect-brk flag inserts a breakpoint at the very top of your script automatically when you run your script. This may be useful if your script contains no debugger statements to manually stop the execution of the script in the debugger.
If you're running a server, then your script will keep running until you shut it down, or you encounter an error that terminates the script. In this situation, you can simply use the --inspect flag instead.
Suppose we have a small Node.js script called server.js that runs a server like so:
const http = require('node:http')

const app = http.createServer((req, res) => {
  res.writeHead(200, { 'Content-Type': 'text/html' })
  res.end('<h1 style="font-size: 5rem;">Hello World</h1>')
})

app.listen(3000)
console.log('Node server listening on port 3000')
You can start the debugger without inserting a breakpoint at the top of the script by running the following command in your terminal:
node --inspect server
If you click on the green Node.js icon in Chrome DevTools to access the Node.js debugger and navigate to the "Sources" tab, you may notice nothing is there.
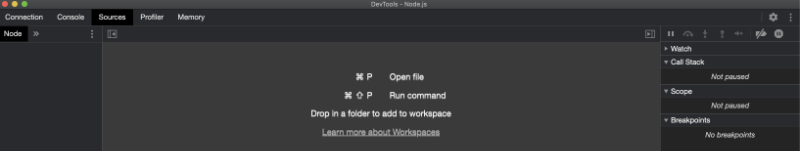
You can open up a file by using Command+P on a Mac. As seen in the screenshot above, it will tell you how to open up the file on your respective operating system. Then, you can select server.js from the dropdown to open up the file in Chrome DevTools.
Now, you can insert breakpoints just like before!
The only difference between using --inspect-brk versus --inspect is that the former inserts a breakpoint at the start of a script, and the latter does not.
Conclusion
That's it! You can now debug Node.js scripts and servers! Show off your new debugging skills to your friends and coworkers. If you catch them using console.log, share this article with them!