Debugging Ruby on Rails in Chrome DevTools
Greetings, friends! Did you know that it's possible Ruby on Rail applications in Chrome DevTools? It's actually really simple!
Attaching Chrome DevTools to rdbg
This article is a direct continuation of my last article where we setup a new Ruby on Rails application.
In that tutorial, we navigated to the inside of our new blog application and used the following command to start the Ruby debugger, rdbg, on a Unix domain socket.
rdbg -n --open -c -- bin/rails s
Then, we could attach VS code to the debugger by selecting the "attach" configuration and running the VS code debugger.
We also learned that there's a shorter way to launch VS Code with the debugger attached using the following command:
rdbg -n --open=vscode -c -- bin/rails s
This will start rdbg, open VS Code automatically, attach VS code to the debugger, and start the Rails server.
When you navigate to http://localhost:3000/articles/index and have a debugger statement inside articles_controller.rb, you should be able to debug within VS Code.
The rdbg debugger actually has the ability to interoperate with the official Chrome DevTools Protocol. This means we can use Chrome DevTools as our debugger instead of VS Code or the terminal.
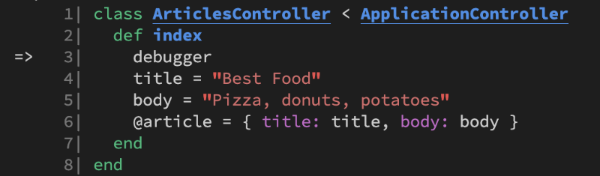
Open articles_controller.rb and make sure you have a debugger statement in the index method:
class ArticlesController < ApplicationController
  def index
    debugger
    title = "Best Food"
    body = "Pizza, donuts, potatoes"
    @article = { title: title, body: body }
  end
end
Then, run the following command inside the blog directory:
rdbg -n --open=chrome -c -- bin/rails s
An instance of Google Chrome should automatically open, and you should be redirected to Chrome DevTools. Open a new tab and navigate to http://localhost:3000/articles/index.
You should automatically be taken to the breakpoint inside articles_controller.rb. You can now insert breakpoints anywhere you want and debug Ruby code as if you were debugging JavaScript in Chrome DevTools. Pretty cool!
Opening Chrome DevTools from within rdbg
Another way we can open the Chrome DevTools debugger is to run the open chrome command while rdbg is being run from the command line or terminal.
Close down your Rails server and debugger. Then, restart the Rails server using the normal bin/rails s command. Navigate to http://localhost:3000/articles/index to activate a breakpoint. Inside your terminal, you should see that we hit a breakpoint thanks to the debugger statement.
Next, run open chrome from within the rdgb debugger that is currently running in your terminal. This will automatically open up a new instance of Chrome DevTools. You may need to visit http://localhost:3000/articles/index again to trigger a breakpoint from within Chrome DevTools.
Conclusion
We can now debug Ruby on Rails applications from within Google Chrome using the Chrome DevTools protocol and the rdgb debugger! It's up to personal preference on whether you want to use Chrome DevTools, VS Code, or a terminal for debugging. As developers, it's nice to have plenty of options available! 😁