Debugging Ruby on Rails in VS Code
Greetings, friends! In the previous tutorial we learned how to get the Ruby debugger working in VS Code by installing the rdbg gem and a VS Code extension called VSCode rdbg Ruby Debugger by Koichi Sasada. In this tutorial, we'll use the same tools to debug a Ruby on Rails application on macOS. Please make sure to read my previous tutorial before reading this one!
Create a New Directory
For this tutorial, I suggest making a new directory to test the debugger with a new Rails application. I will create a new directory called rails_debugging. Then, I will open VS Code with this directory as the root of my project. Make sure you do this if you're following along! It'll be important later!
Once you're more familiar with the debugger, you can apply your newfound knowledge to an existing Rails application. Just make sure that your Ruby and Rails versions are high enough that they are supported by the debug Ruby gem.
Ruby Version for this Tutorial
As of the time of this writing, the latest stable release of Ruby is version 3.1.2. However, I will be using version 3.0.0 for this tutorial, similar to my last tutorial. I recommend using version 3.0.0 or higher.
Within the rails_debugging directory we created earlier, run the following command:
rbenv local 3.0.0
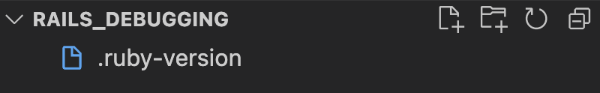
This will create a file called .ruby-version in the current directory.
Installing Ruby on Rails
For Ruby on Rails, the latest stable release is 7.0.3.1, released on July 12, 2022. We will use this version for this tutorial, and we'll install it using rbenv.
Create a new file called Gemfile with the following contents:
source 'https://rubygems.org'
gem 'rails', '7.0.3.1'
Next, we can install Rails using Bundler. Run the following command:
bundle
This should install Rails using rbenv. We can verify that it was installed in the correct path by running the following command:
rbenv which rails
You should see a path similar to the following:
/Users/inspirnathan/.rbenv/versions/3.0.0/bin/rails
Notice how the 3.0.0 refers to the version of Ruby we're using. This helps makes sure gems installed using a particular version of Ruby is stored in the same path.
We can make sure Rails is working correctly by running the following command:
bundle exec rails -v
Running the above command should output Rails 7.0.3.1, since that's the version we specified in our Gemfile.
Next, let's create a new Rails application.
Bootstrapping a new Rails App
We can create a new app using the following command:
bundle exec rails new blog
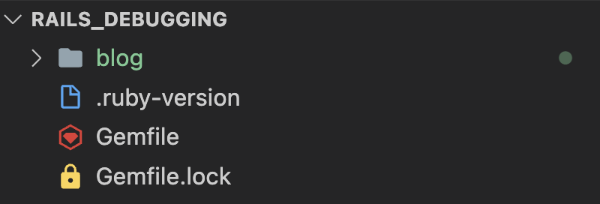
This will create a new directory called blog that contains a brand new Rails application! Notice that within the blog directory, there's another .ruby-version file. It should contain 3.0.0, since that's the version we used to install the Rails gem in the rails_debugging directory.
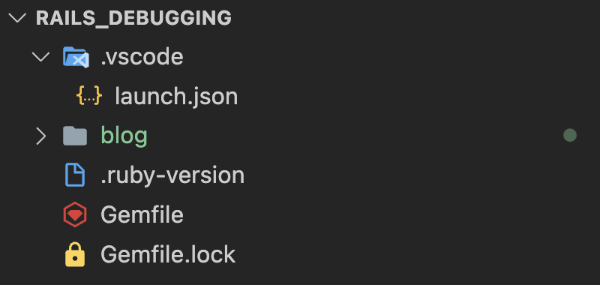
Our directory structure should currently look like following:
Running the Rails Server
Navigate to the newly created Rails directory using cd blog.
rails_debugging directory, or the blog directory if you're having issues running certain commands.We can start our new Rails application in multiple ways. Pick your favorite!
bundle exec rails serverbundle exec rails sbin/rails serverbin/rails srails serverrails s
Once the app is started, you should be able to access the app at http://localhost:3000. You can gracefully shut down the server using Ctrl + C in the terminal.
Your server should gracefully shut down, but you may occasionally run into "A server is already running" error. If this happens, run the following command to get list of processes running on port 3000:
lsof -i:3000
Then, look for a row that has "ruby" in the "COMMAND" column. Copy the number in the corresponding "PID" column and then use that number in the following command:
kill -9 PID_NUMBER
Where PID_NUMBER is replaced with the number you found using the lsof -i:3000 command.
Creating a New Controller and View
Currently, our Rails application is new, and there aren't many great places to showcase the power of Ruby debugging within it. Let's create a new controller and view using the following command:
rails generate controller Articles index
This command will cause Rails to create multiple files that adhere to its usual Model-View-Controller (MVC) architecture. You might see the following output in your terminal.
create  app/controllers/articles_controller.rb
       route  get 'articles/index'
      invoke  erb
      create    app/views/articles
      create    app/views/articles/index.html.erb
      invoke  test_unit
      create    test/controllers/articles_controller_test.rb
      invoke  helper
      create    app/helpers/articles_helper.rb
      invoke    test_unit
The above command created a new file called articles_controller.rb. Replace the contents of this file with the following:
class ArticlesController < ApplicationController
  def index
    @article = { title: "Best Food", body: "Pizza, donuts, potatoes" }
  end
end
This will create an instance variable called @article that we can pass to the corresponding Article view. Let's open up this view and use this variable.
Open up the file located at app/views/articles/index.html.erb and replace everything with the following contents:
<h1>Articles#index</h1>
<p>Find me in app/views/articles/index.html.erb</p>

<h2><%= @article[:title] %></h2>
<p><%= @article[:body] %></p>
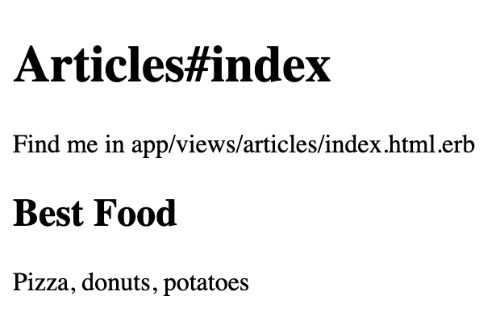
Let's run the Rails server to make sure this page is working! Run rails s to start the server. Then, navigate to http://localhost:3000/articles/index, and you should see the following:
Debugging Time
It's time to debug the Rails application! Unlike the last tutorial, we don't have to manually install the debug gem or create a binstub. Rails already installs and uses the debug gem. If you look inside the Gemfile within the blog directory, you should see the following somewhere in the file:
group :development, :test do
  # See https://guides.rubyonrails.org/debugging_rails_applications.html#debugging-with-the-debug-gem
  gem "debug", platforms: %i[ mri mingw x64_mingw ]
end
By default, the Rails app will use development mode when we start the Rails server using rails s. Therefore, the debug gem will automatically be made available to us!
Remember, installing the debug gem will naturally install the rdbg binary/executable. The rdbg executable is the actual Ruby debugger.
There are multiple ways to debug our new Rails app using rdbg. Here are four methods I found the most useful.
- Start the Rails server in
developmentmode (the default mode) - Launch
rdbgusing VS Code's "launch" configuration - Attach
rdbgto a "debuggee" such as VS Code using the "attach" configuration - Run
rdbgwith theopen=vscodeoption
Let's take a look at each of these four methods.
Method 1 of Debugging with rdbg
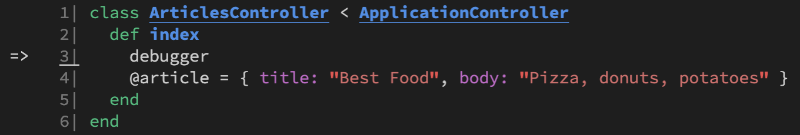
Let's look at example of each of the four methods for debugging with rdbg. For the first method, we need to add a breakpoint somewhere in our code. Let's open the articles_controller.rb file and insert a debugger statement. We should end up with the following:
class ArticlesController < ApplicationController
  def index
    debugger
    @article = { title: "Best Food", body: "Pizza, donuts, potatoes" }
  end
end
Next, start the server using rails s and navigate to http://localhost:3000/articles/index. The page likely won't load because the debugger has already hit the breakpoint in articles_controller.rb. Switch back to your terminal, and you should see that debugger has already started.
You can now look at all kinds of variables here. You can find a list of instructions you can perform in the debugger on the official GitHub page for the debug gem.
You can use c to continue and quit to terminate the debugger (which will likely stop the Rails server as well).
Method 2 of Debugging with rdbg
The next method we will look at involves using the "launch" configuration of VS Code to debug a Rails application using rdgb together with the VSCode rdbg Ruby Debugger we installed in my previous tutorial.
This next step is important. If you've been following along this tutorial, you likely have been using VS Code with the rails_debugging directory opened as the root directory of your project. You can change things later, but I'll be using paths relative to this directory.
Create a .vscode directory in the root of your project, which should be in the rails_debugging directory. Then, create a launch.json file within that directory. Your project structure should now look like the following:
Within the launch.json file, insert the following contents:
{
  // Use IntelliSense to learn about possible attributes.
  // Hover to view descriptions of existing attributes.
  // For more information, visit: https://go.microsoft.com/fwlink/?linkid=830387
  "version": "0.2.0",
  "configurations": [
    {
      "type": "rdbg",
      "name": "Debug current file with rdbg",
      "request": "launch",
      "script": "./blog/bin/rails s",
      "useBundler": false,
      "command": "ruby"
    },
    {
      "type": "rdbg",
      "name": "Attach with rdbg",
      "request": "attach"
    }
  ]
}
Let me explain what this file is doing. As you're probably aware, the launch.json file is a special configuration file that VS Code uses when activating the built-in debugger. The debugger's user interface is generic and meant to be used with multiple programming languages.
The author of the VSCode rdbg Ruby Debugger extension already hooked into the VS Code API that deals with interfacing with VS Code's debugger and the rdgb debugger. Therefore, breakpoints inserted into VS Code can then be picked up by rdgb.
In "Method 1 of Debugging with rdbg", we were using the debugger statement, but it'd be nice to insert breakpoints using VS Code.
In the launch.json file, notice there is a script property and a command property. When we run the VS Code debugger, it will try to execute the rdbg debugger with a particular command. This command will be of the form, command_property script_property, which equates to ruby ./blog/bin/rails s if we use the launch.json configuration above.
Keep in mind that you can change the script property to be whatever path you need for your setup. Just make sure you're running the debugger from within the rails_debugging directory, since we're navigating to ./blog in the script property.
This will all make more sense when we run the VS Code debugger, and you look at the command ran in your terminal.
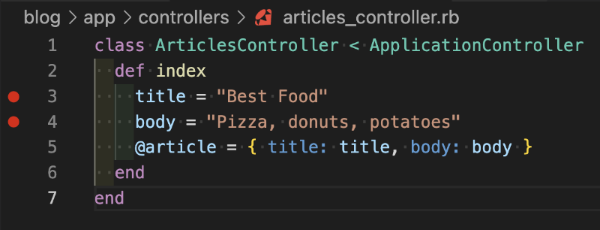
First, let's remove the debugger statement from articles_controller.rb and add a few lines that we'll debug with VS Code later.
class ArticlesController < ApplicationController
  def index
    title = "Best Food"
    body = "Pizza, donuts, potatoes"
    @article = { title: title, body: body }
  end
end
Next, let's insert a breakpoint by clicking to the left of the line numbers next to title and body.
Finally, let's run the debugger! In your terminal, make sure you're in the rails_debugging directory and not the blog directory. Then, navigate to the "Run and Debug" pane in VS Code using Shift + Command + D or by clicking on the "triangle with bug" icon on the left side of VS Code.
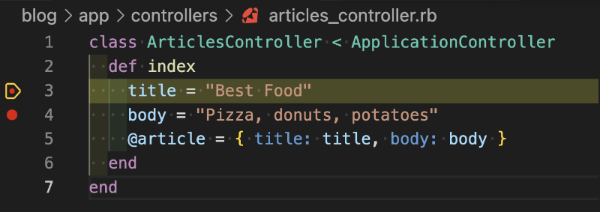
Then, select "Debug current file with rdbg" from the dropdown to the left of the green triangle. Click on the green triangle to run the VS Code debugger.

The rails server should start automatically with the rdbg program attached to VS Code. Navigate to http://localhost:3000/articles/index, and VS Code should automatically take over. You can now debug the Rails application using VS Code!!! 🎉
We can even add additional breakpoints on the fly. In the image below, I added an extra breakpoint to the left of @article.
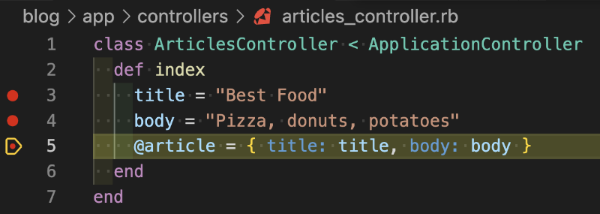
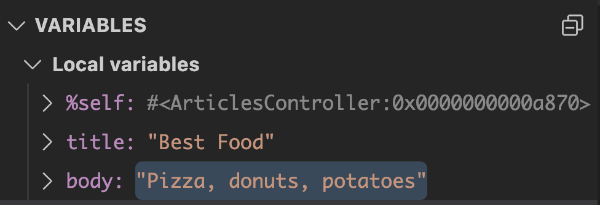
We can even inspect local variables on the left side of VS Code to see what their values are after iterating through a few breakpoints.
We can use the buttons at the top of VS Code to step to the next breakpoint, step inside a function, or use the red square button to close down the debugger and Rails server entirely.
Method 3 of Debugging with rdbg
The third method I'd like to talk about involves the "attach" configuration in VS Code. We can attach rdbg to a "debuggee" such as VS Code, Google Chrome DevTools, and even an application running on a Docker container.
In this tutorial, I'll discuss how to attach rdbg to VS Code. Make sure you have closed down the debugger and Rails server from the last step. Currently, you're probably in the rails_debugging directory from the previous step. Navigate back to the blog directory, so we get access to the Rails binstubs and run the following command:
rdbg -n --open -c -- bin/rails s
This will run the Rails server as a "debuggee." Notice how I'm running the rdbg program with a few options.
The -n option will make sure that the the debugger doesn't immediately start at the beginning of a script (which likely would have been at the start of the /bin/rails.rb file).
The --open option will start remote debugging and open a network port. By default, it'll use open a Unix domain socket (UDS).
The -c option lets us run a command. In this case, it's bin/rails s. Therefore, both the Ruby debugger, rdgb, will start, and the Rails server will start.
With the debugger now listening over a Unix socket, let's now attach VS Code to it using the "attach" configuration. Open up the "Run and Debug" pane using Shift + Command + D. Then, select the "Attach with rdbg" option from the dropdown menu to the right of the green triangle. Click on the green triangle to start the debug process, and VS Code will then be attached to the rdbg process.
Navigate to http://localhost:3000/articles/index, and you should be switched automatically to VS Code. You can now debug and insert breakpoints using VS Code again! The "attach" configuration is much easier to get working, in my opinion, than the "launch" configuration, but they each have their own sets of advantages. The "launch" configuration, when launch.json is setup correctly, is faster, but more complicated.
Method 4 of Debugging with rdbg
Instead of having to manually run the debugger within VS Code, the rdbg tool provides another way to start up VS Code with the debugger attached. We can pass vscode to the --open option, so that we can automatically open VS Code's debugger using the "attach" configuration.
Close out of the Rails server and debugger if you have them currently open. Then, let's go back and add a debugger statement inside articles_controller.rb:
class ArticlesController < ApplicationController
  def index
    debugger
    title = "Best Food"
    body = "Pizza, donuts, potatoes"
    @article = { title: title, body: body }
  end
end
The debugger statement will help us automatically open up articles_controller.rb. Then, make sure you're in the blog directory. Run the following command in your terminal:
rdbg -n --open=vscode -c -- bin/rails s
If successful, this should start rdbg, open a new VS Code instance automatically, attach VS code to the debugger, and start the Rails server.
Navigate to http://localhost:3000/articles/index, and you should automatically be taken to a breakpoint in articles_controller.rb from within the new VS Code instance.
Note that the above command may fail if you don't have the code command in your path. Visit VS Code's page on launching from the command line to get the code command added to your path. It's super simple. Open the Command Palette Command + Shift + P and type 'shell command' to find the Shell Command: Install 'code' command in PATH command.
Conclusion
In this tutorial, we have seen four ways we can debug a Ruby on Rails application using the debug gem and the rdgb debugger program. We can debug Rails application using either the command line or VS Code.
Pretty cool stuff, huh?! Will this be enough to switch Vim users over to VS Code? Probably not, but it sure is fun to debug Ruby and Rails application using VS Code with a shiny and customizable user interface! 😁