Running the JavaScript Profiler from the Console
Greetings, friends! Did you know you can create new JavaScript profiles from within the DevTools console in Google Chrome? The Console Utilities API makes available to us two important functions: profile and profileEnd. The first function starts a new profile, and the second one stops it from running. Let's look at an example.
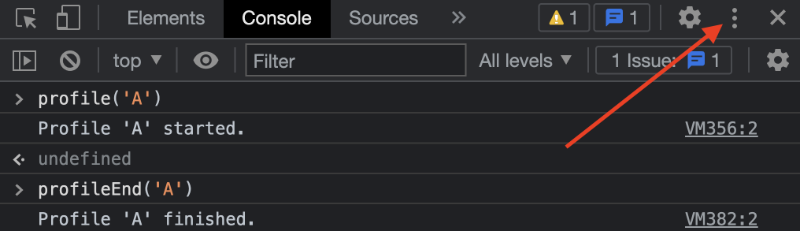
Open up the Chrome DevTools console and run the following:
profile('A');
Wait a few seconds and then run the following in the console:
profileEnd('A');
You should see in the console that Profile 'A' finished. In order to inspect this new CPU profile, we need to navigate to the "JavaScript Profiler" option in Chrome DevTools. Click on the kebab menu icon (vertical three dots) and under More tools, you should see an option for JavaScript Profiler.
You can also use Command + Shift + P on a Mac or Ctrl + Shift + P on Windows to open up the DevTools Command Menu. From there, you can choose Show JavaScript Profiler.
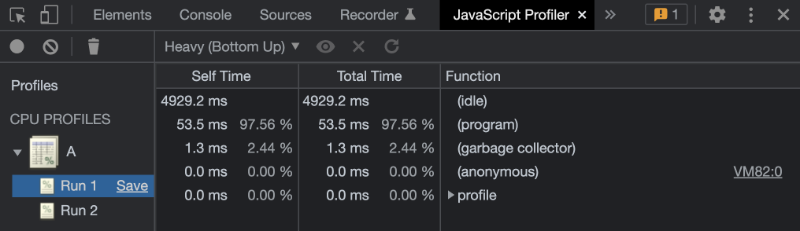
In the screenshot above, the profile A can be seen under CPU PROFILES. We can run profile('A') and profileEnd('A') again in the console to create additions runs. This is why Run 1 and Run 2 appear.
The profile and profileEnd functions are shortcuts for creating JavaScript profiles in Chrome DevTools. These profiles can help developers understand the performance of various functions in their code and built-in functions called by the JavaScript engine.