Debug Functions in the Console
Greetings, friends! In Google Chrome, there is a special debug function that we can use. This function is part of the Console Utilities API.
The debug function lets us invoke the debugger inside a specified function. Let's create an environment to experiment with debug. First, create an index.html file with the following contents:
<!DOCTYPE html>
<html lang="en">
<head>
  <meta charset="UTF-8">
  <meta http-equiv="X-UA-Compatible" content="IE=edge">
  <meta name="viewport" content="width=device-width, initial-scale=1.0">
  <title>Printing DOM Elements as JSON Objects</title>
</head>
<body>
  <h1>Debugging Functions in the Console</h1>
  <script src="main.js"></script>
</body>
</html>
Next, let's create a JavaScript file called main.js with the following contents:
const sayHello = () => {
  console.log('Greetings, friends!');
};

const logFoodArray = (foodArray) => {
  foodArray.forEach((food) => console.log(food));
};
If you open the index.html file in Google Chrome, the main.js script will load and make sayHello and logFoodArray available to us in the console. We can open the Google Chrome console using the keyboard shortcut Option + Command + J on a Mac or Ctrl + Shift + J on Windows.
If you run sayHello() in the console, then you should see Greetings, friends! logged to the console. Suppose we wanted to debug and see inside this function without having to insert a breakpoint or debugger statement in our code. We can use the debug utility to speed up our debugging process!
Insert the following code into the console:
debug(sayHello);
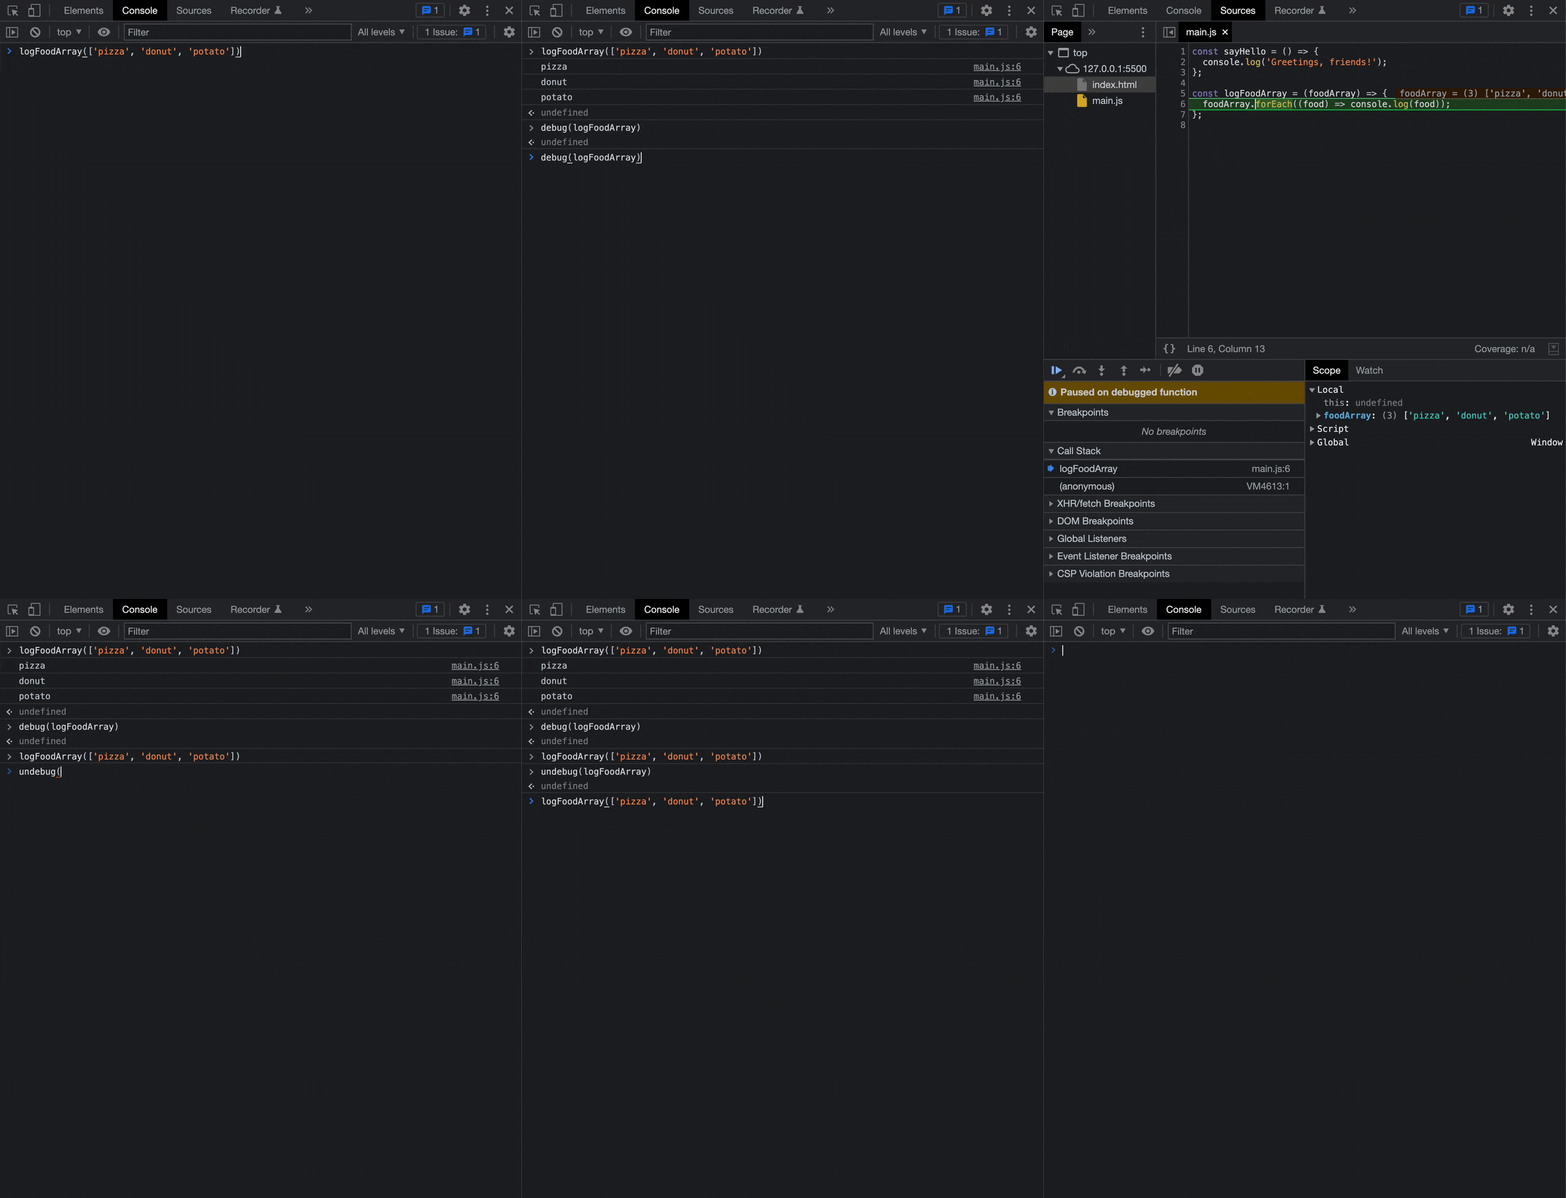
The sayHello function now has a debugger attached. Let's try running the function again.
sayHello();
After executing this function, you should now see the debugger appear!

If you want to stop invoking the debugger, you can call the undebug function. This is another utility provided by Google Chrome in the console.
undebug(sayHello);
If you try running sayHello() in the console, the debugger will no longer be invoked. You can also refresh the page if you want to stop invoking the debugger on all your functions that were passed into the debug utility.
We can also add a debugger to the logFoodArray function we defined in main.js. If you look under the "Scope" tab in the debugger, you can actually see the contents of the foodArray parameter that we pass into the logFoodArray function!

The debug utility is a handy little shortcut for activating the debugger for any specified function. We can use the undebug utility to stop the debugger from being invoked. The debugger is like that friend who loves to gossip about everything, giving us tons of information. Sorry, console.log! We have a new best friend! I'm just kidding though 😂. Using console.log is simpler and could be just what you need! Use whichever tool you're more comfortable with and helps you get the job done! 🌟