Console Log Levels
Greetings, friends! Today, I will discuss different log levels you may see in the console from within your browser. I will talk about the differences between console.log, console.info, console.warn, console.error, and console.debug. For this tutorial, I will use the Google Chrome browser, but log levels apply to other browsers such as Firefox and Safari.
Log Levels
Each console method is assigned a severity level or log level. In Google Chrome, log levels include Verbose, Info, Warning, and Error. Some console methods won't belong to any of these four log levels, since they may not log anything to the console. Below is a table that displays each console method available in Google Chrome's Console API and the corresponding log level.
| Method | Log Level |
|---|---|
| console.assert | Error |
| console.clear | None |
| console.count | Info |
| console.countReset | None |
| console.debug | Verbose |
| console.dir | Info |
| console.dirxml | Info |
| console.error | Error |
| console.group | None |
| console.groupCollapsed | None |
| console.groupEnd | None |
| console.info | Info |
| console.log | Info |
| console.table | Info |
| console.time | None |
| console.timeEnd | Info |
| console.trace | Info |
| console.warn | Warning |
Displaying Each Log Level
In Google Chrome, you can open up the Chrome DevTools console using the keyboard shortcut Option + Command + J on a Mac or Ctrl + Shift + J on Windows. By default, Google Chrome will show you only three log levels: Info, Warnings, and Error. If you click on the "Log Levels" dropdown, you can see which log levels are shown or hidden. A checkmark next to a log level indicates that anything logged to the console that corresponds to that log level will be visible.
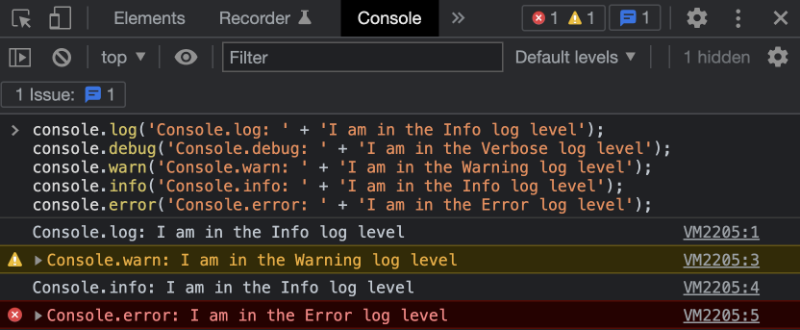
Let's look at an example. Copy the following code and paste it into the console.
console.log('Console.log: ' + 'I am in the Info log level');
console.debug('Console.debug: ' + 'I am in the Verbose log level');
console.warn('Console.warn: ' + 'I am in the Warning log level');
console.info('Console.info: ' + 'I am in the Info log level');
console.error('Console.error: ' + 'I am in the Error log level');
In Google Chrome, the warning messages are highlighted in yellow, and the error messages are highlighted in red. Notice that both console.log and console.info belong to the Info log level.
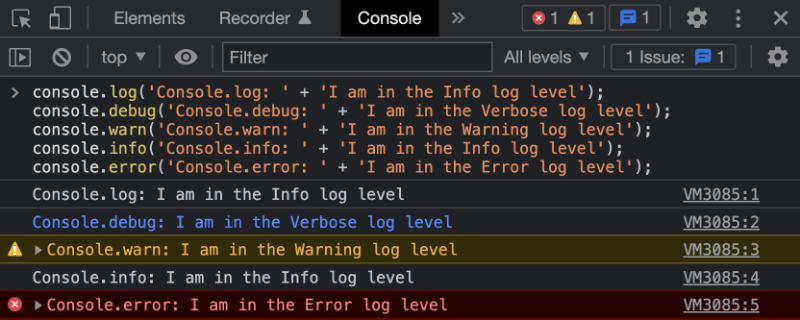
Looks like we're still missing the console.debug statement. By default, Google Chrome will hide the Verbose log level. If you click on the "Log Levels" dropdown and display the Verbose log level, then you'll see all messages logged from the console.debug method. The text in this log level will be colored blue.
Console.info versus Console.log
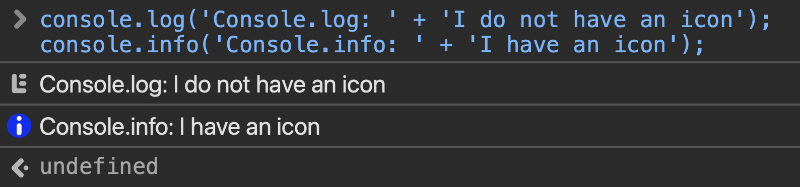
In Google Chrome, the console.info message is actually identical to console.log. In Firefox and Safari, a small "i" icon is displayed next to the console.info. Below is a screenshot of Safari's console.
Conclusion
Each log level helps organize your logs, so they can convey information about your code after it runs in the browser. Authors of code libraries will generally use these log levels to indicate the severity of a log. For example, the library author could display an error when a dependency is missing or if you ran a function incorrectly. They could display warnings when your package needs updated, or if there's a performance issue. The console.debug method is rarely used, but it could be useful for displaying very verbose messages with detailed descriptions. Since Google Chrome groups them in a different category, it could be useful for further organization. It's up to you to decide which one should be displayed to the user as you're writing your code.